Analyze your last 15 posts in 10 Minutes (using Content Trust System)
This edition introduces Trust Architecture, a 4-prompt AI diagnostic system that scores content against four trust stages (Recognition, Credibility, Risk Reduction, Commitment).

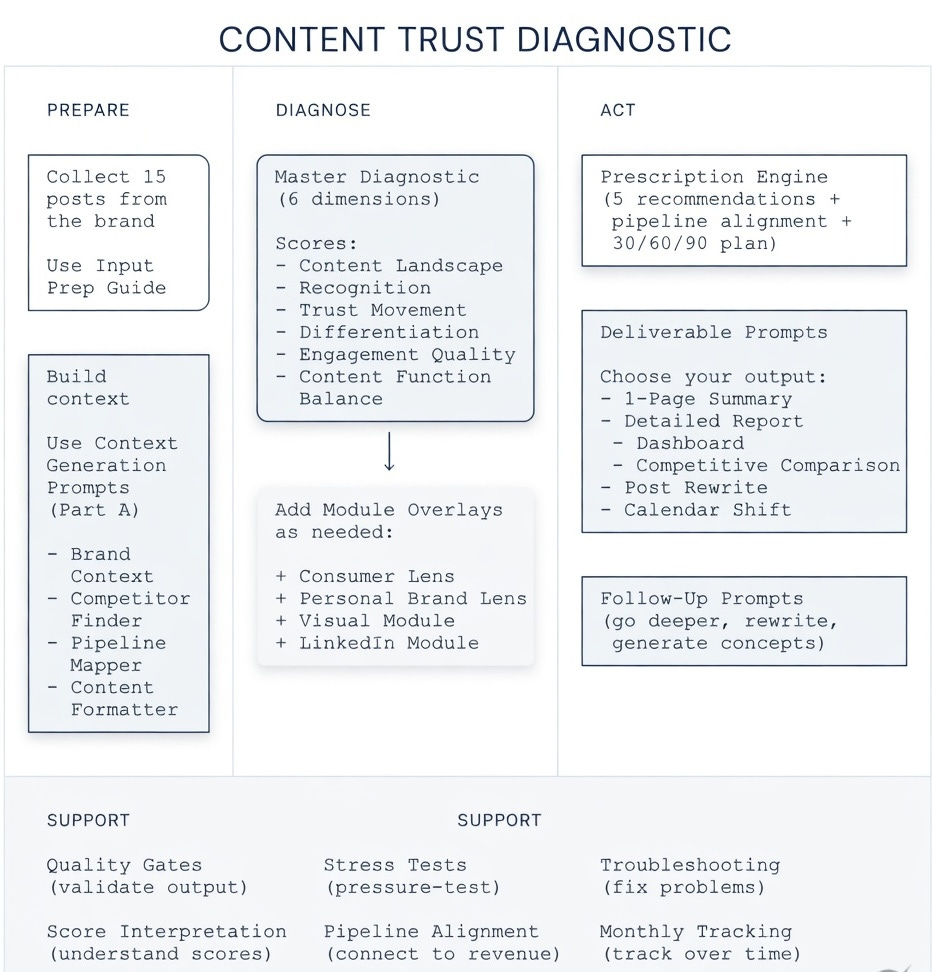
I built a 4-prompt diagnostic that scores trust movement instead of engagement. Here’s the system, the prompts, and a real brand’s results.
You’ve done a content audit before. Or maybe you haven’t, because you already suspected the output wouldn’t justify the time.
Either way, you know the exercise: open the feed, scroll through posts, drop observations into a spreadsheet.
“They post 4x per week.”
“Carousels outperform static images.”
“60% of their content is educational.”
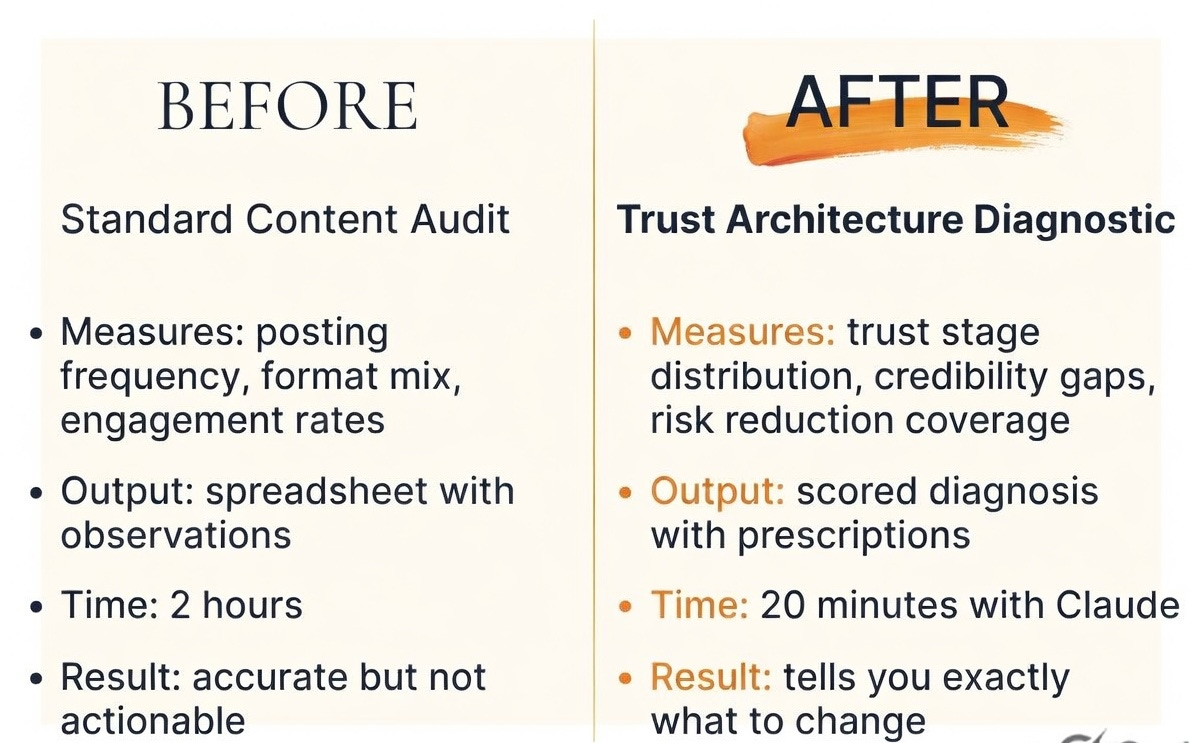
Two hours of work. Every observation is accurate, but none of it guides you what to actually change.
The reason is simple. A standard content audit measures two things:
“what was posted and how people reacted to it. Activity and engagement.”
It never touches the question that moves the pipeline:
“what did the audience come to believe about this brand because of this content? Did anyone move closer to trusting them enough to book a call, start a trial, or spend money?”
You need to know what’s working and what’s broken.
I kept running into this gap with client work until I stopped measuring engagement entirely and started measuring something else: “trust movement”.
I call the framework “Trust Architecture”, and it changed how I look at every piece of content.
Trust Architecture: The Four Stages
Content should be measured against trust stages.
Engagement stages and Awareness stages are becoming “vanity metrics” with AI slop.
Because trust is what converts. Someone can be aware of your brand for years and never buy. Trust is what closes the gap between “I’ve seen this before” and “I’m ready to act.”
Four stages:
Recognition → Credibility → Risk Reduction → Commitment

Recognition — Does the audience know this brand exists?
Content that builds recognition: consistent posting, visual branding, topic ownership, showing up regularly. This is the “I’ve seen this brand before” stage.
Credibility — Does the audience believe this brand knows what it’s talking about?
Content that builds credibility: original research, specific case results, transparent methodology, contrarian positions backed by evidence, sharing what actually happened instead of what should happen.
For personal brands and solopreneurs, credibility also comes from vulnerability, demonstrated personal results, and transparent behind-the-scenes process. This is the “I trust their expertise” stage.
Risk Reduction — Has the content addressed the fears that stop people from acting?
Content that reduces risk: customer stories with outcomes, social proof, transparent pricing, addressing objections head on, showing what the process of working with the brand actually looks like.
For personal brands, event photos, speaking appearances, and showing your real working environment also reduce risk because they prove you’re a real person doing real work. This is the “I believe this could work for me” stage.
Commitment — Does the content make the next step clear and easy?
Content that drives commitment: specific calls to action, free tools, trial offers, booking links, first-step resources. This is the “I’m ready to act” stage.
Map a typical B2B brand’s content to these stages. What you’ll usually find: roughly 55% Recognition, 10% Credibility, 5% Risk Reduction, 30% Commitment.
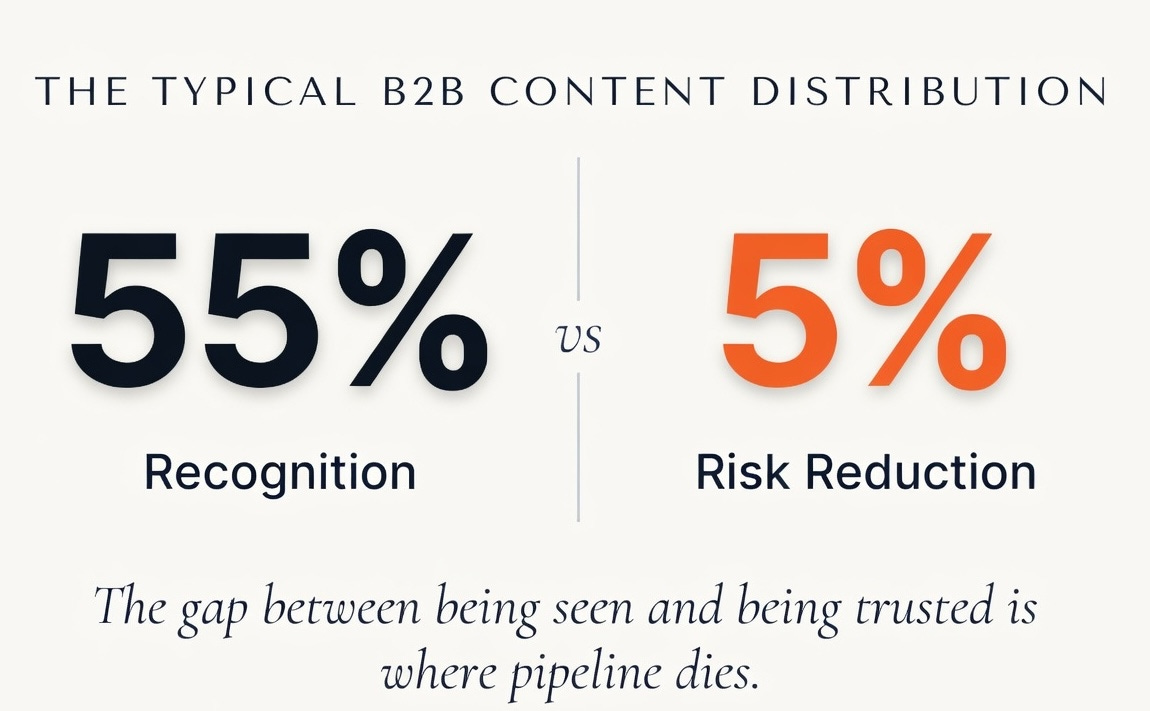
That distribution is why a brand can have solid engagement and a flat pipeline at the same time. The audience sees them and remembers they exist. But the brand jumps from “you’ve heard of us” straight to “buy from us” without building the credibility or reducing the risk that makes buying feel safe. The middle of the trust journey is empty.
Most B2B brands have a trust gap between Recognition and Credibility. Their audience knows who they are but has no reason to trust their expertise over anyone else’s. That gap is where pipeline goes to die.
The fix isn’t more content. The fix is reallocating what you already produce.
Shift some Recognition content to Credibility by replacing regular posts with evidence-based content.
Shift some Commitment content to Risk Reduction by replacing CTAs with customer stories and objection handling.
Same volume. Different trust movement. Different pipeline.
Save this: Trust Architecture: Recognition (they know you) → Credibility (they trust you) → Risk Reduction (they believe you) → Commitment (they act). Score your last 15 posts against these four stages. That’s your content trust diagnostic.
Why This Connects to Your Pipeline
A trust gap isn’t a content problem. It’s a revenue problem.
Every business has a funnel with drop-off points. Each trust stage feeds a specific drop-off point.
If your content has a trust gap at Credibility, your pipeline leaks where prospects need to believe your expertise.
If the gap is at Risk Reduction, your pipeline leaks where prospects need proof it’ll work for them specifically.
The content diagnostic tells you where the gap is. Your pipeline data tells you what that gap costs.
You don’t need attribution software to see this. You need to know where your funnel breaks and then check whether your content is feeding that stage or not.
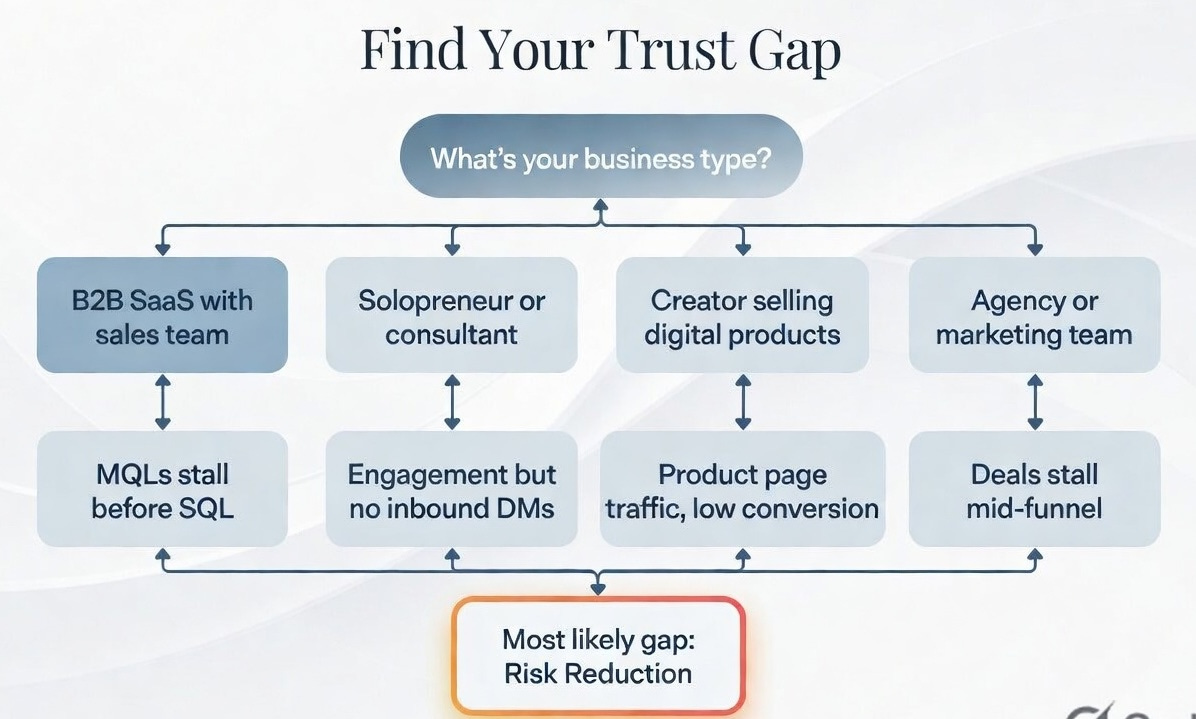
Here’s how Trust Architecture maps to pipeline for different types of businesses. Find yours.
If you’re a B2B SaaS company with a sales team:
Low Recognition Where your pipeline breaks: Not enough inbound. Low branded search. Prospects don’t know you exist. What you’ll hear: “Who are these guys?”
Low Credibility Where your pipeline breaks: Traffic exists but nobody converts to MQL. People visit your site and leave. What you’ll hear: “Their blog is fine but I don’t see why they’re better than [competitor].”
Low Risk Reduction Where your pipeline breaks: MQLs stall before becoming SQLs. Prospects are interested but won’t commit to a sales call. What you’ll hear: “I like what they do but I need to see more proof it works for companies like ours.”
Low Commitment Where your pipeline breaks: Prospects take calls but don’t close. The last step has too much friction. What you’ll hear: “I couldn’t figure out how to actually get started.”
Your demo-to-close rate dropping from 28% to 19%? Check Risk Reduction.
Prospects who take a demo but don’t buy almost always have an unresolved objection that your content never addressed.
If you’re a solopreneur, consultant, or freelancer:
Low Recognition Where your pipeline breaks: Not enough followers. Low impressions. Nobody sees your content. What you’ll hear: (silence)
Low Credibility Where your pipeline breaks: People follow you but never engage. They scroll past your posts. What you’ll hear: “I see their stuff but it’s the same advice everyone shares.”
Low Risk Reduction Where your pipeline breaks: People engage but never DM you about working together. They trust your expertise but don’t believe you can help them specifically. What you’ll hear: “They seem smart but I don’t know what it’s like to actually work with them.”
Low Commitment Where your pipeline breaks: People DM you but conversations die. No clear next step. What you’ll hear: “I was interested but I couldn’t figure out what they offer or how to start.”
If you’re getting 50 likes per post and zero inbound DMs, the issue is almost certainly a Risk Reduction gap. Your audience trusts your expertise in the abstract. They don’t believe it applies to them.
If you’re a creator selling a digital product ($50–500):
Low Recognition Where your pipeline breaks: Low impressions, slow follower growth. What you’ll hear: “Never heard of them.”
Low Credibility Where your pipeline breaks: People follow but don’t save or share your content. It’s not valuable enough to bookmark. What you’ll hear: “Nice content but nothing I need to come back to.”
Low Risk Reduction Where your pipeline breaks: People visit your product page but bounce. Not enough testimonials, previews, or proof. What you’ll hear: “Looks interesting but $197 is a lot and I don’t know if it’s actually good.”
Low Commitment Where your pipeline breaks: People want to buy but the process is confusing, the pricing is unclear, or the CTA is buried. What you’ll hear: “I tried to buy but I couldn’t find the link.”
If your product page gets traffic but your conversion rate is below 2%, the issue is almost certainly Risk Reduction. Add 3 specific customer results with numbers, a preview of what the product looks like inside, and an FAQ that addresses the top 3 objections.
If you’re an agency or marketing team reporting to leadership:
Low Recognition Where your pipeline breaks: Low share of voice. Competitors own the conversation. What your VP will ask: “Why are we invisible in our category?”
Low Credibility Where your pipeline breaks: Content gets engagement but target accounts don’t engage. What your VP will ask: “Are we reaching the right people?”
Low Risk Reduction Where your pipeline breaks: Deals stall in mid-funnel. Sales asks marketing for more case studies every week. What your VP will ask: “Why does every prospect want more proof before they commit?”
Low Commitment Where your pipeline breaks: Content doesn’t appear in the buying journey. Prospects close without ever seeing marketing content. What your VP will ask: “Is content actually contributing to anything?”
If your sales team constantly asks for case studies and competitive battle cards, your content has a Risk Reduction gap. The content team is producing thought leadership that nobody in an active deal ever sees.
The pattern across all four scenarios: Most businesses over-invest in Recognition (being seen) and under-invest in Risk Reduction (being trusted enough to act). The trust gap and the pipeline bottleneck are almost always in the same place. Fix the trust gap, remove the pipeline barrier.
What This Looks Like on a Real Brand
I ran this diagnostic on a B2B SaaS brand’s LinkedIn last week. Details are disguised, but the scores are real. Pay attention to how the trust scores connect to the pipeline problem at the bottom.
DIAGNOSTIC SNAPSHOT
====================
Brand: [Disguised B2B SaaS, project management tool]
Platform: LinkedIn
Posts analyzed: 15 (across 3 weeks)
CONTENT TRUST SCORES:
Recognition Score: 4/5 (strong visibility, consistent posting)
Credibility Score: 2/5 (mostly generic educational content)
Risk Reduction Score: 1/5 (almost zero proof content)
Commitment Score: 3/5 (regular CTAs and product announcements)
Differentiation Score: 2/5 (interchangeable with 3 competitors)
Engagement Quality: 3/5 (decent activity, but 35% is employee engagement and congratulatory comments)
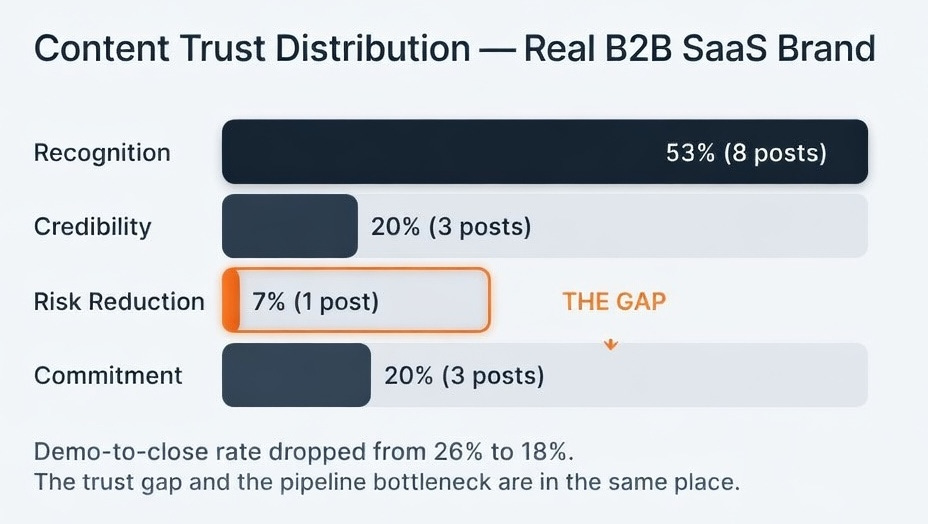
TRUST STAGE DISTRIBUTION:
Recognition: 8 posts (53%)
Credibility: 3 posts (20%)
Risk Reduction: 1 post (7%)
Commitment: 3 posts (20%)
THE GAP:
Risk Reduction is nearly empty. Only 1 post in 15 addresses buyer objections, shows what working with the product looks like, or provides customer proof with specific outcomes.
PATTERN (from Combination Engine):
High recognition + low trust movement = the brand is visible but not credible. Audience knows who they are but has no reason to trust their recommendations over anyone else’s.
High engagement + low differentiation = the brand is entertaining but forgettable. People like the posts but couldn’t tell you what makes this brand different from three competitors in the same space.
PIPELINE ALIGNMENT:
The brand’s demo-to-close rate dropped from 26% to 18% last quarter. Win/loss interviews show the top objection is “implementation complexity.” Zero content addresses this objection.
The trust gap (Risk Reduction at 7%) and the pipeline bottleneck (prospects stalling after demo) are in the same place. Prospects who see the demo believe the product works in theory. They don’t believe it will work for their team in practice. That’s a Risk Reduction failure that content should be solving.
PRESCRIPTIONS:
#1: Shift 3 of 10 weekly posts from educational tips to posts showing specific methodology with real client numbers. Example: “How [anonymized client] cut project delivery time by 35% in 60 days using our sprint planning workflow.” Trust Movement impact: moves Credibility from 20% to 35%.
#2: Replace 2 weekly promotional posts with customer story posts that directly address the implementation objection. Show the actual onboarding timeline, the real effort required, and the specific outcomes. Risk Reduction impact: moves from 7% to 20% and directly targets the pipeline bottleneck.
#3: Create one “what working with us looks like” post per month. Walk through a real customer’s first 30 days: what happened, what was hard, what the outcome was. This is the single highest-leverage content type for a brand with a Risk Reduction gap.
90-DAY MEASUREMENT PLAN:
30 days: Did we actually shift the content mix? Count posts per trust stage. Target: Risk Reduction from 7% to 15%+.
60 days: Are prospects engaging differently? Track: DM inquiries mentioning case studies or implementation. Track: reduction in “send me more proof” requests from sales team.
90 days: Is the pipeline bottleneck moving? Track: demo-to-close rate. Target: recover from 18% toward 22%+.
The pipeline alignment section is something the individual prompts can’t produce on their own. The prompts diagnose the content. The pipeline alignment connects that diagnosis to what it’s costing you. The prescriptions tell you exactly what to change, and the measurement plan tells you how to know if it worked.
The Prescription Engine and the Pipeline Alignment module generate the full version of this output with 5 prescriptions, scenario-specific pipeline mapping, and a 30/60/90 measurement framework. Those are in the complete system on Gumroad. More on that below.
The Prompts That Run This Diagnostic
Here are the prompts. Paste any of them into Claude with a brand’s last 15 posts and get a scored analysis back. Takes about 5 minutes per prompt.
Before you paste: Best results come from text input. Copy the post text, engagement numbers (likes, comments, shares), and the top 3–5 comments for each post. Screenshots work but engagement data may be incomplete. Specify whether you’re analyzing your own brand or a competitor, since the diagnosis frames differently for each.
Prompt 1: Content Landscape Map
Use this to find out what a brand talks about and what topics are completely missing.
You are a content analyst mapping the full content landscape for a brand.
I will provide you with the last 15 posts from [BRAND NAME] on [PLATFORM].
CONTEXT:
- Am I analyzing my own brand or a competitor? [OWN / COMPETITOR]
- How often does this brand post? [e.g., 3x/week, daily, 10x/week]
NOTE: If fewer than 10 posts are provided, state upfront that the sample is too small for reliable distribution analysis. Provide per-post observations instead of aggregate percentages. Flag all conclusions as directional, not diagnostic.
NOTE: If this brand posts more than 10x per week, 15 posts may represent less than 2 weeks of content. State that the analysis covers a limited window and recommend sampling across 4-6 weeks for a complete picture.
FOR EACH POST:
Identify the primary topic, secondary topic (if any), and content format.
Formats vary by platform:
- LinkedIn: text post, carousel, video, poll, article, document, newsletter
- Instagram: static image, carousel, Reel, Story, collab post, Guide
- X/Twitter: text, image, video, thread, quote tweet, poll
- YouTube: long video, short video, Shorts, community post
- TikTok: video, duet, stitch
Use the platform-appropriate format list.
OUTPUT:
CONTENT LANDSCAPE MAP
======================
Brand: [name]
Platform: [platform]
Analysis type: [Own brand / Competitor]
Posts analyzed: [number]
Date range: [earliest post to latest post]
TOPIC DISTRIBUTION:
[List each topic with count and percentage. Group related subtopics under parent themes.]
FORMAT DISTRIBUTION:
[List each format with count and percentage, using platform-specific format categories.]
TOPIC GAPS:
[What topics relevant to this brand’s space are MISSING entirely? What would you expect to see from a brand in this category that is not present?]
If this is a COMPETITOR analysis: Frame gaps as “Opportunities your brand could fill that this competitor is leaving open.”
OVER-INDEXED TOPICS:
[Any topic that appears in more than 40% of posts. Is this intentional authority-building or repetitive content? For solopreneurs and personal brands, topic focus is often intentional. Note this.]
ONE SENTENCE DIAGNOSIS:
[The single most important content landscape finding.]
Prompt 2: Differentiation Analysis
Use this to find out how much of a brand’s content could have been posted by a competitor.
You are a content strategist analyzing how differentiated a brand’s content is from competitors in their space.
I will provide you with the last 15 posts from [BRAND NAME] on [PLATFORM], along with their industry or competitive category.
CONTEXT:
- Competitive category (be specific): [e.g., “CI/CD tools for mid-market engineering teams” not just “developer tools”]
- Name 3-5 closest competitors: [names]
- Am I analyzing my own brand or a competitor? [OWN / COMPETITOR]
- Is this a personal brand or company brand? [PERSONAL / COMPANY]
NOTE: If fewer than 10 posts are provided, flag that the sample is too small for reliable scoring. Provide per-post scores but note that the average may not represent the brand’s true differentiation.
FOR EACH POST, score on a 1-5 scale:
1 = GENERIC. Any competitor in this space could have posted this verbatim. No unique perspective, data, or methodology.
2 = LIGHTLY BRANDED. Has the brand’s voice but the substance is interchangeable with competitor content.
3 = PARTIALLY DIFFERENTIATED. Contains some unique angle or proprietary data but the core message is common.
4 = CLEARLY DIFFERENTIATED. Uses original frameworks, specific case data, or methodology that competitors don’t have.
5 = OWNABLE. Only this brand could have posted this. It references specific proprietary work, unique client outcomes, or original research.
PERSONAL BRAND CALIBRATION: If this is a personal brand, distinguish between VOICE differentiation (personal stories, unique personality) and INTELLECTUAL differentiation (original ideas, proprietary frameworks, unique data). Personal stories score high on voice but should be assessed separately on whether the IDEAS are differentiated.
A personal brand with a unique voice but generic advice still has a differentiation gap on the intellectual axis.
OUTPUT:
DIFFERENTIATION ANALYSIS
==========================
Brand: [name]
Platform: [platform]
Analysis type: [Own brand / Competitor]
Posts analyzed: [number]
Competitive category: [stated category]
Named competitors: [listed competitors]
Overall Differentiation Score: [average of all posts, to one decimal]
Score Distribution:
1 (Generic): [count] posts
2 (Lightly Branded): [count] posts
3 (Partially Differentiated): [count] posts
4 (Clearly Differentiated): [count] posts
5 (Ownable): [count] posts
[If personal brand] Voice vs. Intellectual Differentiation:
Voice differentiation: [X/5]
Intellectual differentiation: [X/5]
DIFFERENTIATION BY CONTENT TYPE:
[Group scores by content type: educational/tips, personal stories, promotional, curated, opinion/contrarian. Report average score per type. The gap between types is often more actionable than the overall average.]
TOP DIFFERENTIATORS:
[Which 3 posts scored highest? What makes them hard to copy?]
SUBSTITUTABLE CONTENT:
[Which posts scored 1-2? What would make them harder to replicate?]
If this is a COMPETITOR analysis: Note which differentiation vectors the competitor does NOT own. These are available for your brand to claim.
ONE SENTENCE DIAGNOSIS:
[The single most important differentiation finding.]
Prompt 3: Trust Movement Scoring
This is the one that changes how you look at content. Use this to find out if posts are building trust or just filling feeds.
You are a content strategist analyzing how effectively a brand’s content moves audiences through trust stages. Trust is the bridge between awareness and action. Content that builds trust converts. Content that builds only visibility does not.
I will provide you with the last 15 posts from [BRAND NAME] on [PLATFORM].
CONTEXT:
- Am I analyzing my own brand or a competitor? [OWN / COMPETITOR]
- Is this a personal brand or company brand? [PERSONAL / COMPANY]
- What is the conversion action? (e.g., book a call, start a trial, buy a product, subscribe, donate) [ACTION]
NOTE: If fewer than 10 posts are provided, state upfront that the sample is too small for reliable distribution analysis. Provide per-post trust stage assignment but flag that percentages are directional only.
NOTE: If this brand posts more than 10x per week, note that 15 posts covers a limited window and may not represent the full trust strategy.
THE TRUST STAGES:
1. RECOGNITION: Does this content help the audience identify and remember the brand?
Indicators: consistent visual identity, recurring themes, topic ownership, showing up regularly.
2. CREDIBILITY: Does this content make the audience believe the brand knows what it is talking about?
Company brand indicators: original data/research, specific case examples, methodology transparency, contrarian takes backed by evidence, showing what actually happened (not what “should” happen).
Personal brand indicators: all of the above PLUS vulnerability and transparency about failures, demonstrated personal results with specifics, behind-the-scenes of actual work process.
CREDIBILITY FALSE POSITIVE TEST: Does this post make me trust THIS BRAND specifically, or does it just share information anyone could share? Generic tips, industry statistics without original analysis, and best practices without proprietary evidence are Recognition content wearing a Credibility costume. Reclassify them.
3. RISK REDUCTION: Does this content address the fears and objections that prevent the audience from acting?
Company brand indicators: customer stories with specific outcomes, social proof, transparent pricing/process, directly addressing common objections, showing what working with the brand looks like.
Personal brand indicators: all of the above PLUS event appearances and speaking photos (proves you are real), showing your actual working environment, personal endorsements from recognized people.
4. COMMITMENT: Does this content create a clear, low-friction path to a next step?
Indicators: specific CTAs, free tools/resources, trial/demo offers, consultation booking, first-step guides.
FOR EACH POST:
Assign it to the ONE trust stage it primarily serves. If a post serves multiple stages, assign it to the strongest one.
NOTE ON TRACTION MILESTONES: Posts about funding, customer counts, revenue, or team growth serve multiple trust stages. Classify by framing: if the post emphasizes the number alone, it is Recognition.
If it includes proof of why the number matters, it is Credibility.
If it includes customer context or social proof, it is Risk Reduction.
OUTPUT:
TRUST MOVEMENT ANALYSIS
========================
Brand: [name]
Platform: [platform]
Analysis type: [Own brand / Competitor]
Brand type: [Personal / Company]
Conversion action: [stated action]
Posts analyzed: [number]
Trust Stage Distribution:
Recognition: [X posts] ([X%])
Credibility: [X posts] ([X%])
Risk Reduction: [X posts] ([X%])
Commitment: [X posts] ([X%])
TRUST MOVEMENT SCORE (1-5):
1 = Content builds visibility only. Zero credibility or risk reduction. Audience knows the brand exists but has no reason to trust or act.
2 = Some credibility signals but inconsistent. Risk reduction almost absent. The brand occasionally demonstrates expertise but doesn’t sustain it.
3 = Credibility building is present but not dominant. Some risk reduction exists. The brand is building trust but not strategically.
4 = Clear credibility building through evidence-based content. Risk reduction is active. The audience can see why this brand is worth trusting.
5 = Systematic trust building across all stages. Content moves audiences through a clear progression from recognition to commitment. Rare.
(Reserve this score for brands with clear evidence at every stage. If evidence is thin at any stage, score 4 maximum.)
TRUST GAPS:
[Which trust stage is most neglected? What is the consequence for the brand’s ability to convert audience attention into business outcomes?]
If COMPETITOR analysis: Frame as “Trust stage your brand can dominate that this competitor is leaving empty.”
TRUST FALSE POSITIVES:
[Apply the Credibility False Positive Test to every post classified as
Credibility. Flag any that are actually Recognition in disguise.]
THE BOTTLENECK:
[Where is the audience getting stuck in the trust journey? Which transition is broken: Recognition > Credibility? Credibility > Risk
Reduction? Risk Reduction > Commitment? Be specific about what content is missing at the broken transition point.]
ONE SENTENCE DIAGNOSIS:
[The single most important trust movement finding.]
Prompt 4: Engagement Quality Analysis
Use this to separate real audience interest from passive scrolling. Not all engagement is equal. 100 likes and 0 comments tells a very different story than 30 likes and 25 comments.
You are a content analyst evaluating the QUALITY of engagement on a brand’s social media content. Not all engagement is equal. 100 likes and 0 comments tells a different story than 30 likes and 25 comments.
I will provide you with the last 15 posts from [BRAND NAME] on [PLATFORM], including visible engagement metrics and sample comments where available.
CONTEXT:
- Am I analyzing my own brand or a competitor? [OWN / COMPETITOR]
- Approximate follower/subscriber count: [number]
- Approximate number of employees (for company pages): [number]
REQUIRED: Engagement metrics (at minimum, like count and comment count) must be provided for at least 10 of 15 posts. If engagement data is missing for more than 5 posts, state this limitation clearly and cap the Overall Engagement Quality Score at 2. Do not infer engagement patterns from post content alone.
NOTE: If analyzing a competitor, engagement data is limited to what is publicly visible. Scores will be approximate. Focus on engagement type patterns rather than absolute scores.
NOTE: If fewer than 10 posts are provided, flag that the sample is too small for reliable analysis.
FOR EACH POST WITH VISIBLE ENGAGEMENT:
Categorize the engagement into these types:
- PASSIVE APPROVAL: Likes, generic emoji reactions, poll votes.
Indicates the content was pleasant or interesting enough to tap but didn’t provoke thought. Poll votes are a subcategory of passive approval (even lower signal than likes because voting is effortless).
- ACTIVE DISCUSSION: Comments with substance (more than 3 words, sharing a perspective, adding information). Indicates the content made someone think enough to type. NOTE: Short congratulatory comments (”congrats!”, “love this!”, “amazing”) are PASSIVE APPROVAL in comment form, not Active Discussion.
- QUESTIONS: Comments asking for more information, clarification, or how to apply the content. Indicates genuine interest and intent.
- SHARING WITH COMMENTARY: Reposts/shares where the sharer adds their own perspective. Indicates the content was worth broadcasting to the sharer’s own audience.
- TAG/MENTION: Comments that tag another person. Indicates the content reminded someone of a colleague or friend (social currency).
OUTPUT:
ENGAGEMENT QUALITY ANALYSIS
============================
Brand: [name]
Platform: [platform]
Analysis type: [Own brand / Competitor]
Follower count: [stated count]
Posts analyzed: [number]
Overall Engagement Quality Score (1-5):
1 = Almost entirely passive. Likes only. No conversation generated.
2 = Mostly passive with occasional comments. Comments are shallow.
3 = Mix of passive and active. Some posts generate real discussion.
4 = Consistently generates substantive comments and questions.
Audience is engaged beyond surface level.
5 = Community-level engagement. Audience members respond to each
other, not just the brand. Content sparks ongoing conversation.
Engagement Type Distribution (across all analyzed posts):
Passive Approval: [X%]
Active Discussion: [X%]
Questions: [X%]
Sharing with Commentary: [X%]
Tag/Mention: [X%]
ENGAGEMENT RATE CONTEXT:
[If follower count is provided, note the average engagement rate (total engagement / followers) per post. Flag if absolute engagement is high but relative engagement is low (audience growth outpaced content quality) or if absolute engagement is low but relative engagement is high (engaged niche audience).]
ENGAGEMENT INTEGRITY CHECK:
[Flag suspected engagement pod activity: multiple commenters appearing on every post, comments that are similar in length and enthusiasm, comments posted within minutes of publication. Flag if more than 30% of comments appear to come from employees, executives, or affiliated accounts. If either flag is raised, note that the Engagement Quality Score may be inflated. If employee engagement exceeds 30%, report two scores: overall and non-employee.]
TOP ENGAGEMENT DRIVERS:
[Which 3 posts generated the highest quality engagement? What do they have in common? What content characteristics drove real discussion vs. passive likes?]
ENGAGEMENT FALSE POSITIVES:
[Flag posts with high like counts but zero or near-zero comments.
These are VISIBILITY posts, not ENGAGEMENT posts. Also flag posts where comments are primarily short congratulatory messages, single emojis, or tag-only comments. These inflate comment counts without indicating real discussion.]
ENGAGEMENT GAPS:
[Is the brand generating questions from the audience? If not, the content is broadcasting, not conversing. Is anyone sharing with commentary? If not, the content isn’t valuable enough for someone to stake their own reputation on recommending it.]
ONE SENTENCE DIAGNOSIS:
[The single most important engagement quality finding.]
These 4 prompts cover content mapping, differentiation, trust movement, and engagement quality.
The complete diagnostic adds 2 more dimensions and the entire implementation system, that you can’t replicate with the free prompts: Content Function Balance (is the brand’s content doing the right jobs?) and the Pattern Combination Engine (what do paired scores across all six dimensions reveal that individual scores miss, like the “entertaining but forgettable” insight in the sample output above).
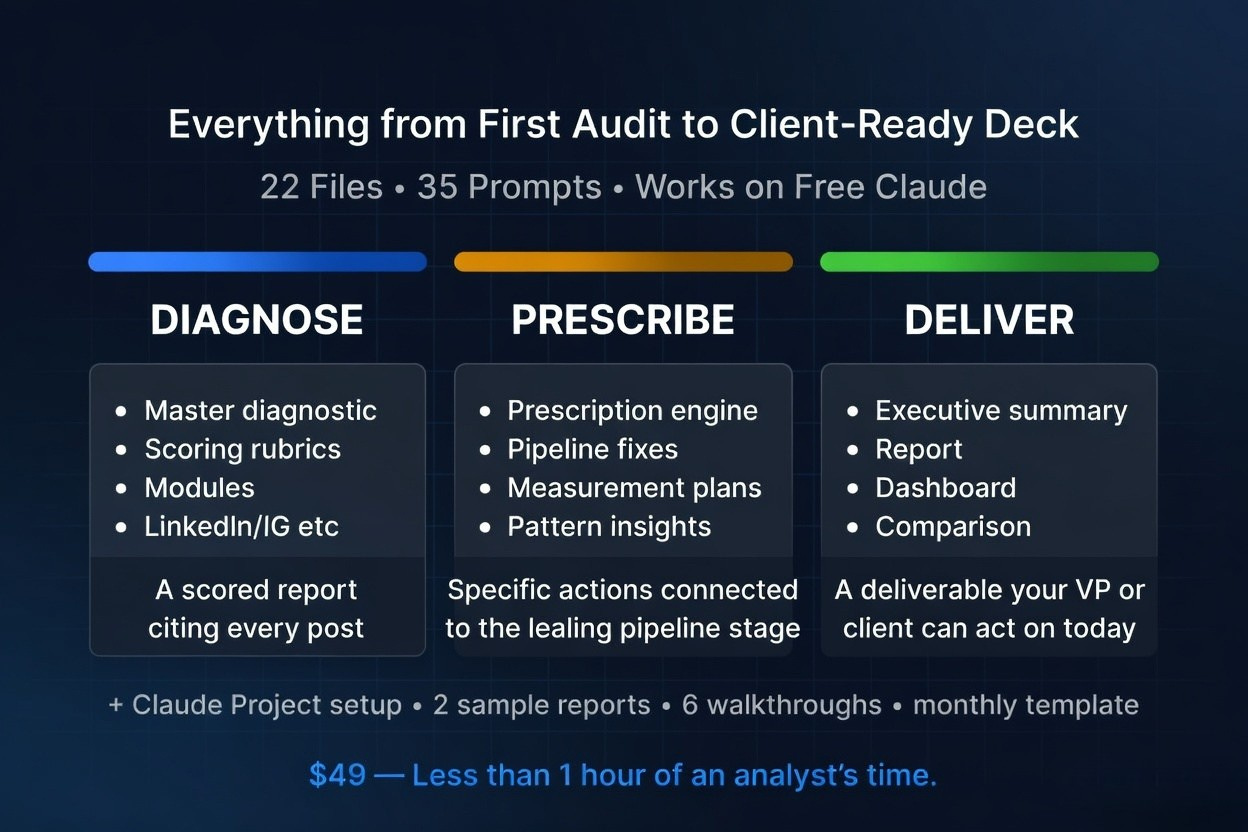
The Full System
This newsletter gives you the Trust Architecture framework, the pipeline alignment model, and all 4 diagnostic prompts. The Gumroad product gives you the complete, assembled system:
All 6 dimension prompts with calibrated scoring rubrics (1-5 scales, defined criteria, consistent outputs)
The Pattern Combination Engine (cross-dimensional insights you can’t get from individual prompts)
Pipeline Alignment module with scenario-specific mapping for B2B SaaS, solopreneurs, creators, and agencies
The Prescription Engine (5 specific, prioritized recommendations with implementation steps and 30/60/90 measurement plan)
Consumer Lens Overlay (switches from B2B authority to consumer resonance metrics)
Visual Content Module (analyze Instagram and Facebook screenshots directly in Claude)
LinkedIn Platform Module (calibrated for thought leadership and B2B dynamics)
Setup guides for 4 levels of Claude integration, from simple chat to fully automated recurring audits
2 sample diagnostic reports with full pipeline alignment (B2B + Consumer)
Quick Start Guide with Claude plan compatibility
Try It This Week
Next time you sit down to audit content, don’t open a spreadsheet. Open Claude. Paste Prompt 3 with your last 15 posts. The diagnosis takes 5 minutes.
Run it on your own brand’s content this week and reply to this email with your Trust Movement score. I’ll share anonymized results in the next issue so you can see where you stand relative to other brands.
Loved this?
And subscribe to “Prompts Daily Newsletter” as well…
If you’re not a subscriber, here’s what you missed earlier:
Build an ICP so specific your message gets reply - The Pressure Profile ICP System (with Prompts)
I get 3x more inbound from comments than posts - My entire prompt system
The AI Partner Stack: 8 Roles as My Advisory Board (Part 2 of 2)
How You Should Actually Plan 2026: [Implementation Guide with Prompts]
Find trends before others: Frameworks, Techniques, Sources and Prompts
The Market Entry Timing Equation: When Being Early Wins and When It Kills You
The Viral LinkedIn GTM Playbook: Frameworks That Drove Engagement and Leads
The Offer Testing Matrix: 6 B2B Hooks That Convert Cold Prospects into Pipeline
Subscribe to get access to the latest marketing, strategy and go-to-market techniques . Follow me on Linkedin and Twitter.