

The Market Entry Timing Equation: When Being Early Wins and When It Kills You
This comprehensive guide reveals the T-Score methodology trusted by B2B founders to calculate optimal launch windows using market readiness signals, defensibility analysis, and competitive positioning

🎯 Who Should Read This (And Who Should Skip)
Read This If:
You’re 3-6 months from planned launch and debating timing
You’re choosing between first-mover category creation vs fast-follower execution
You’re preparing fundraising and need market timing validation
You’ve launched too early and burning through runway on market education
You’re a VC/advisor helping portfolio companies with timing decisions
Skip This If:
You’ve already launched and grown past $10M ARR (timing decision made)
You’re in a regulated industry where timing is dictated by compliance (framework still useful but limited)
You prefer qualitative strategic frameworks over quantitative analysis
⚡ Quick-Start Option (If You’re Time-Constrained)
30-Minute Power Reader Path:
Read Intro + T-Score Formula explanation (5 min)
Use T-Score Quick Calculator (10 min)
Skim Market Readiness signals + calculate your MRS (10 min)
Read your T-Score threshold interpretation (3 min)
Skip to Week 1 Roadmap for next steps (2 min)
Result: Preliminary launch/wait decision with action plan. Return later for comprehensive deep-dive when preparing board presentation or fundraising deck.
Before you start,
I released a free assessment earlier- “Growth Assessment - Find Your Perfect Path”
It has already helped many founders stop wasting time on the wrong growth tactics.
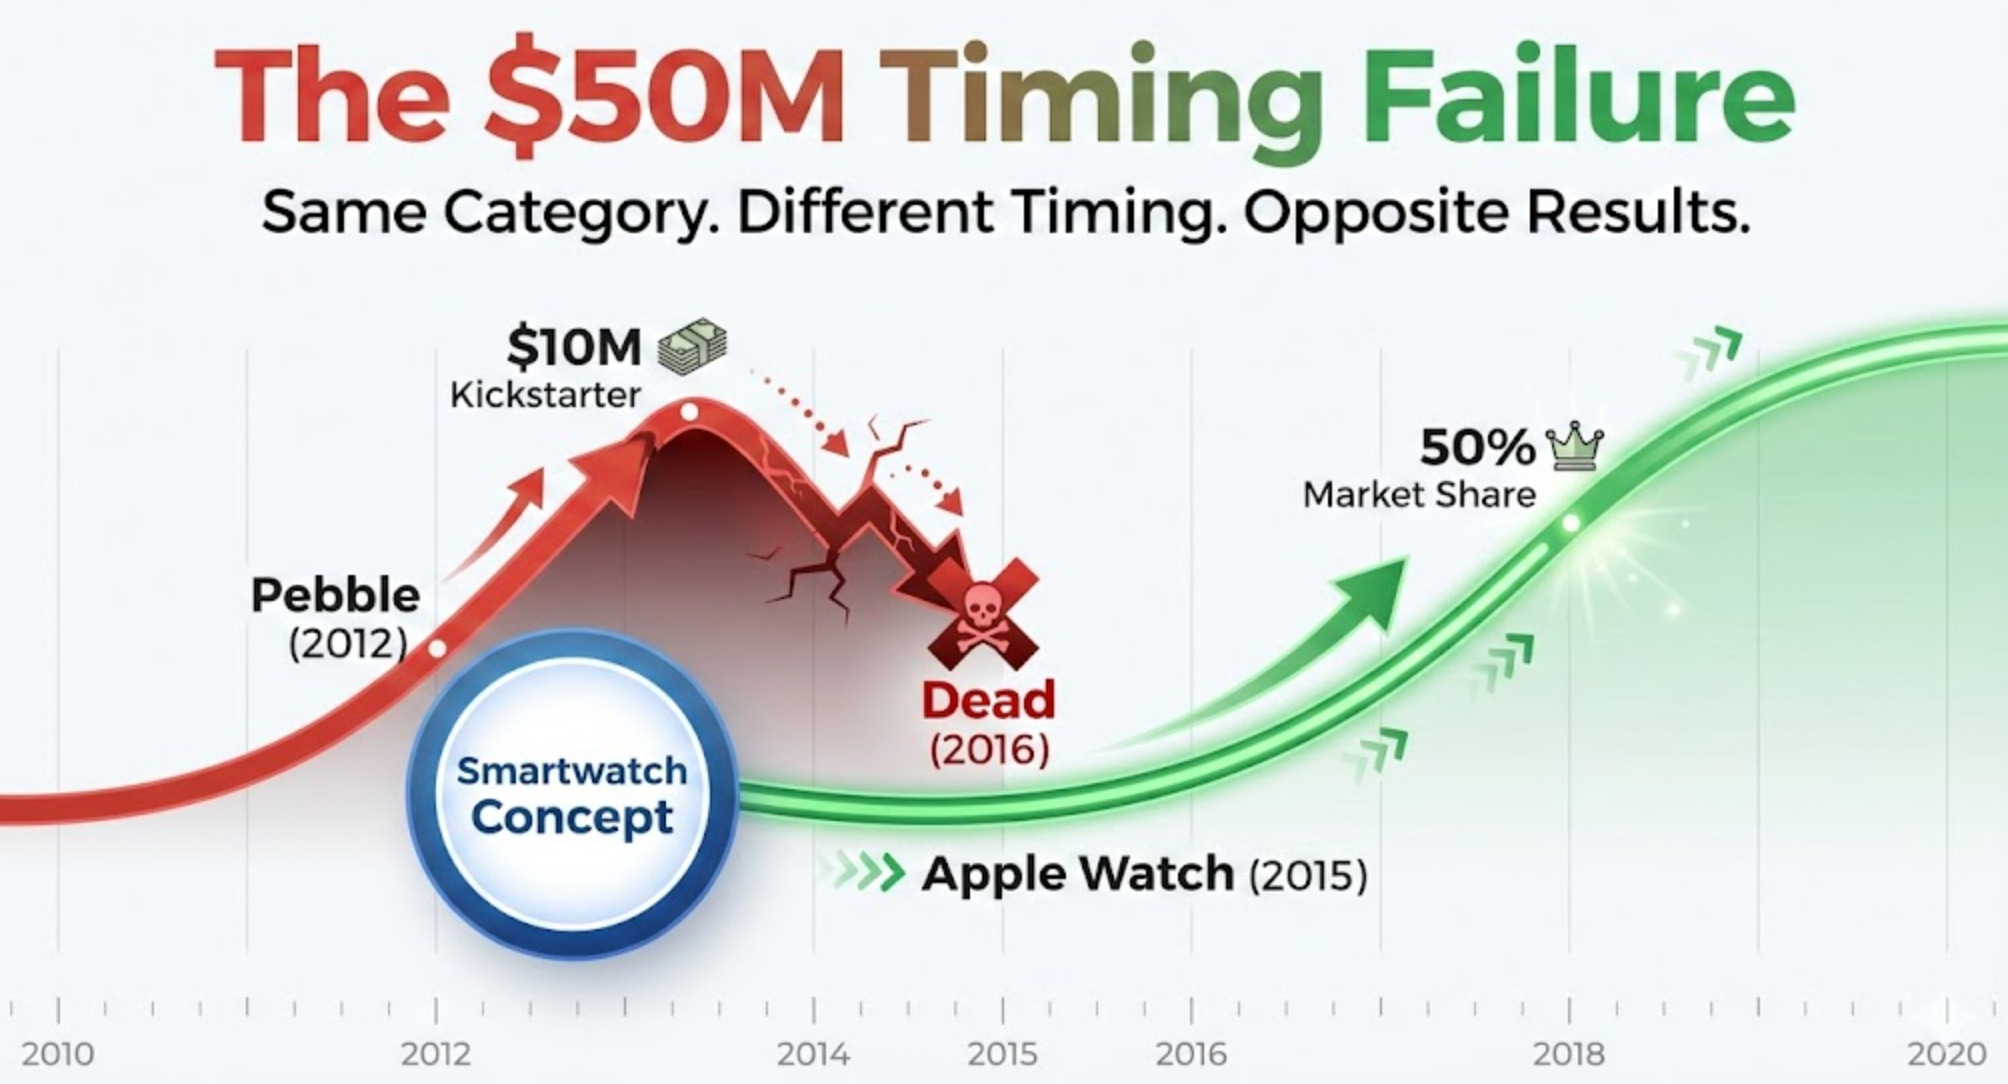
In 2012, Pebble raised $10.3 million on Kickstarter.
The most successful crowdfunding campaign in history at the time.
They shipped the world’s first smartwatch.
Tech media went wild. Early adopters lined up.
Three years later, Apple entered the market.
By 2016, Pebble was dead. Apple Watch commanded over 50% market share and continues to dominate today.
This wasn’t an execution failure. Pebble built a solid product with passionate users.
This wasn’t a funding problem. They raised more than $50M total across crowdfunding and multiple rounds.
This wasn’t even a competition problem.
This was a timing problem.
For 5 years after witnessing similar timing failures, I kept asking: “How do you know when to launch versus wait?”
Everyone talks about “first-mover advantage.”
VCs backed founders who claim to be “creating a category.”
Startup news and media celebrate innovative pioneers.
But the data tells a completely different story.
As per a historical analysis of roughly 500 brands across 50 product categories, Peter Golder and Gerard Tellis found that true market pioneers rarely end up as long-run category leaders. In their data, pioneers had a 47% failure rate, averaged only about 10% market share, and were the current market leader in just 11% of categories.
By contrast, “early leaders” i.e. firms that entered after the pioneer but captured leadership during the category’s growth phase had failure rates around 8%, an average market share near 28%, and ended up as the long-run leader in a majority of categories studied.
Source: StudySmart AI Analysis
Market timing isn’t about gut feel or founder intuition, it’s about quantifying three variables: Market Readiness Score, Defensibility Index, and CAC Volatility.
Combine them correctly and you get a T-Score that tells you whether your timing creates competitive advantage or kills your company.
The Pattern
Companies with T-Scores below 8 died from being too early (Pebble, early metaverse tools, Jasper AI’s pre-ChatGPT burn).
Companies with T-Scores between 12-20 dominated their categories (Google entering search in 1998, Apple Watch in 2015, ChatGPT as a fast-follower to OpenAI’s earlier models).
The breakthrough realization: Timing decisions require data.
This framework converted weeks of “should we launch now or wait?” strategic debates into 6-hour Week 1 execution.
It enabled fast-followers to enter at optimal timing windows with 3-10× better CAC efficiency than too-early competitors who had already spent millions educating the market.
What You’ll Get
In this newsletter, I’m sharing the complete T-Score methodology:
The formula (Section 1)
The 10-minute calculator
The 7-signal market readiness framework (Section 2)
The three-moat defensibility analysis (Section 3)
Historical validation through case studies (Section 4)
The economic costs of bad timing (Section 5)
Your Week 1 implementation roadmap (Section 6)
By the end of Week 1, you’ll have your launch/wait decision.
Let’s start with the fastest way to get your answer.
The T-Score Framework - Making Timing Measurable
T-Score Quick Calculator (10-Minute Decision Tool)
Before we dive deep into market timing science, let me give you the immediate value you came for: a way to get your launch/wait answer in the next 10 minutes.
Just take a print and fill it.
Now that you have your preliminary T-Score, let’s understand exactly how this formula works and why these variables matter.
The T-Score Formula: Quantifying Launch Timing
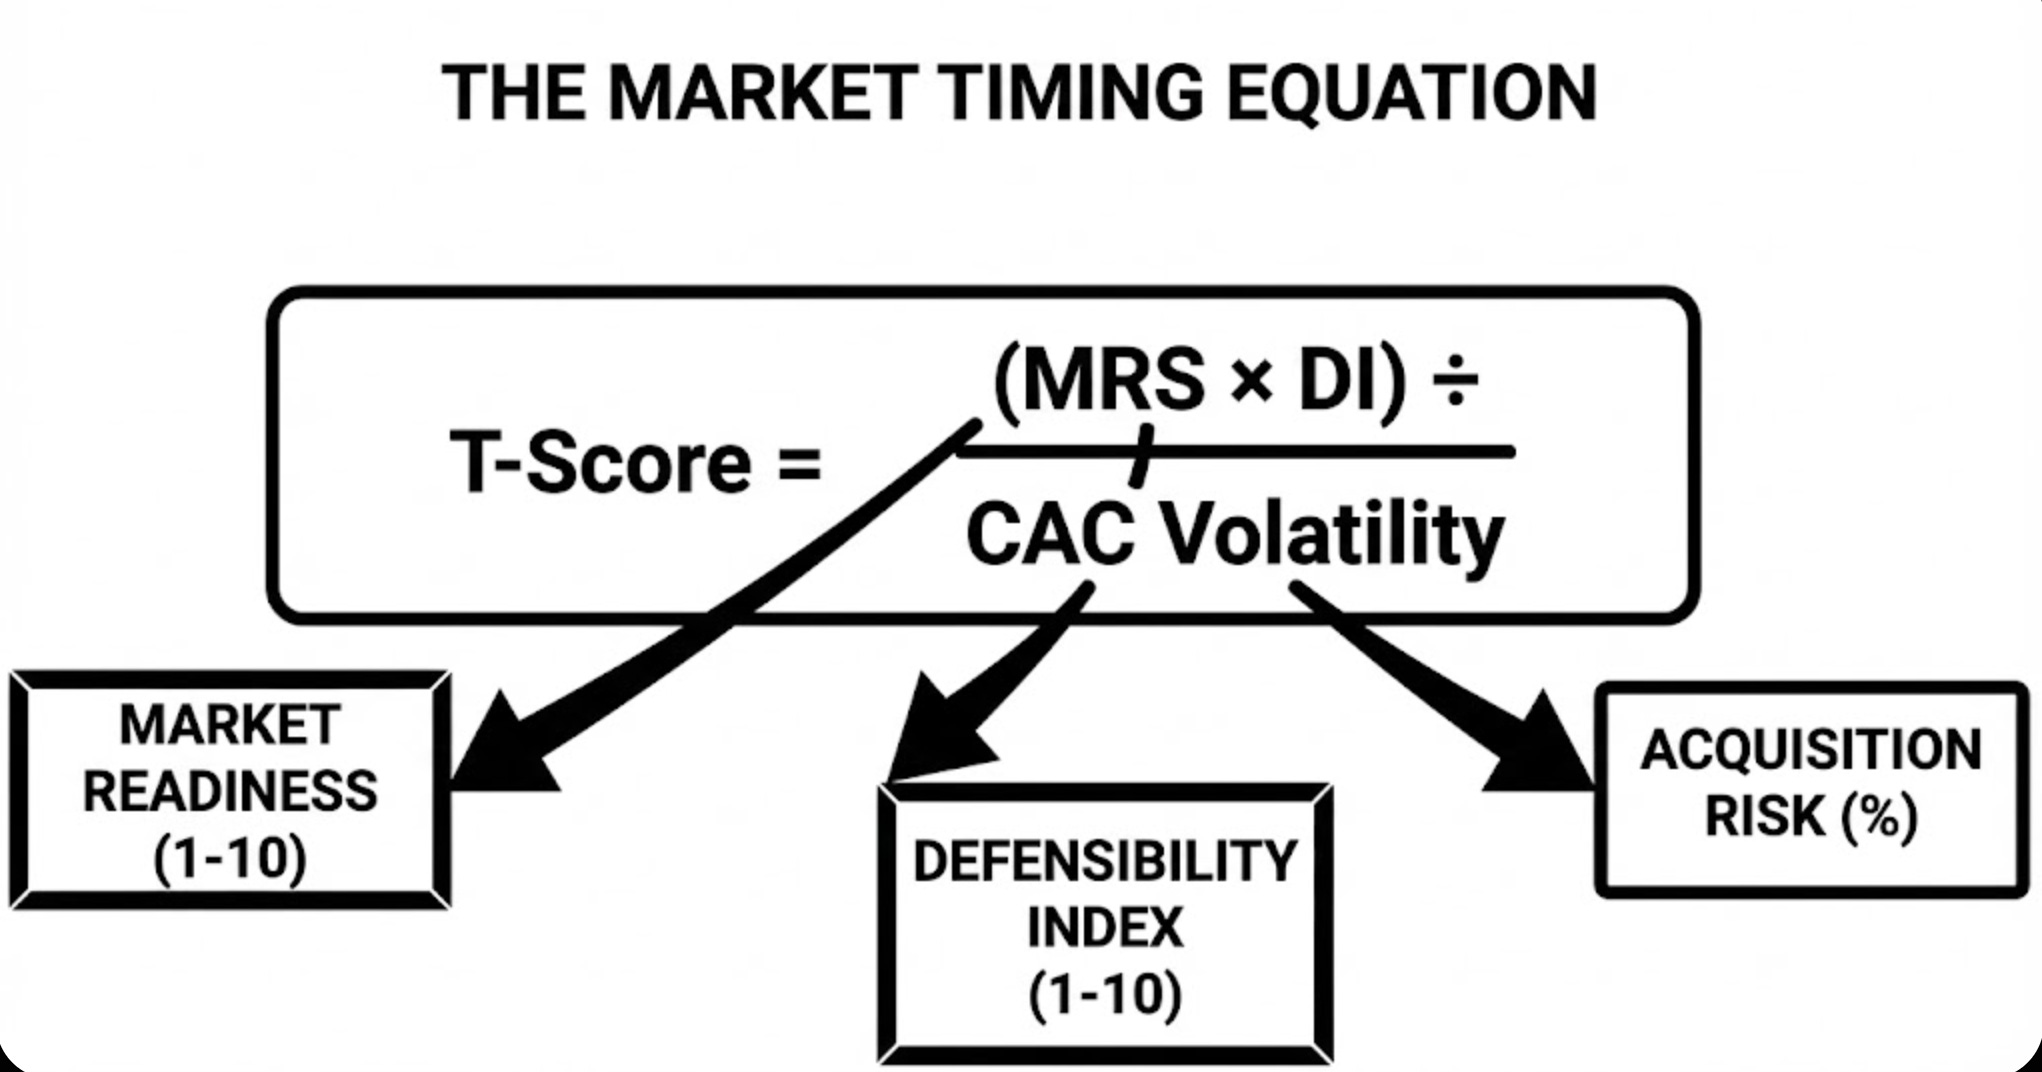
So when should you launch? Here’s the equation that makes timing measurable:
T-Score = (Market Readiness Score × Defensibility Index) ÷ CAC Volatility Impact
Let me explain why this formula structure works.
Multiplication in the Numerator (MRS × DI): Multiplication captures compounding effects.
A ready market (8/10) with strong defensibility (8/10) creates 64 units of potential.
That same ready market (8/10) with weak defensibility (3/10) creates only 24 units.
The math reflects strategic reality: Both factors must be present for optimal first-mover timing.
High readiness with low defensibility means competitors will flood in (you want to be a fast-follower, not first).
High defensibility with low readiness means you’ll burn capital educating a market not ready to buy (wait or start niche).
Division by CAC Volatility (Denominator): Volatility represents market timing risk.
High volatility (60% Coefficient of Variation) means your customer acquisition cost swings wildly month-to-month - a clear signal of an unstable, early market.
Low volatility (25% CV) means channels are proven and economics predictable.
By putting volatility in the denominator, we correctly penalize early entry: High volatility increases the denominator, lowering your T-Score.
As markets mature and volatility decreases, the denominator shrinks, raising your T-Score… exactly the relationship we want.
Score Thresholds: When to Launch vs Wait
T-Score < 8: Too Early Zone
Market unready, education burn will kill you.
Observed failure rate: 70%+ within 24 months.
Classic examples: Pebble (2012 smartwatch, T-Score 4-6), early metaverse platforms (2021-2022, T-Score 3-5), Webvan (1999 grocery delivery, T-Score 2-4).
Why they died:
Spent 2-4× higher CAC educating customers about category concept. Burned through capital before market readiness improved. Channels unstable (no playbook existed).
By the time market was ready, they were out of runway and better-capitalized fast-followers entered.
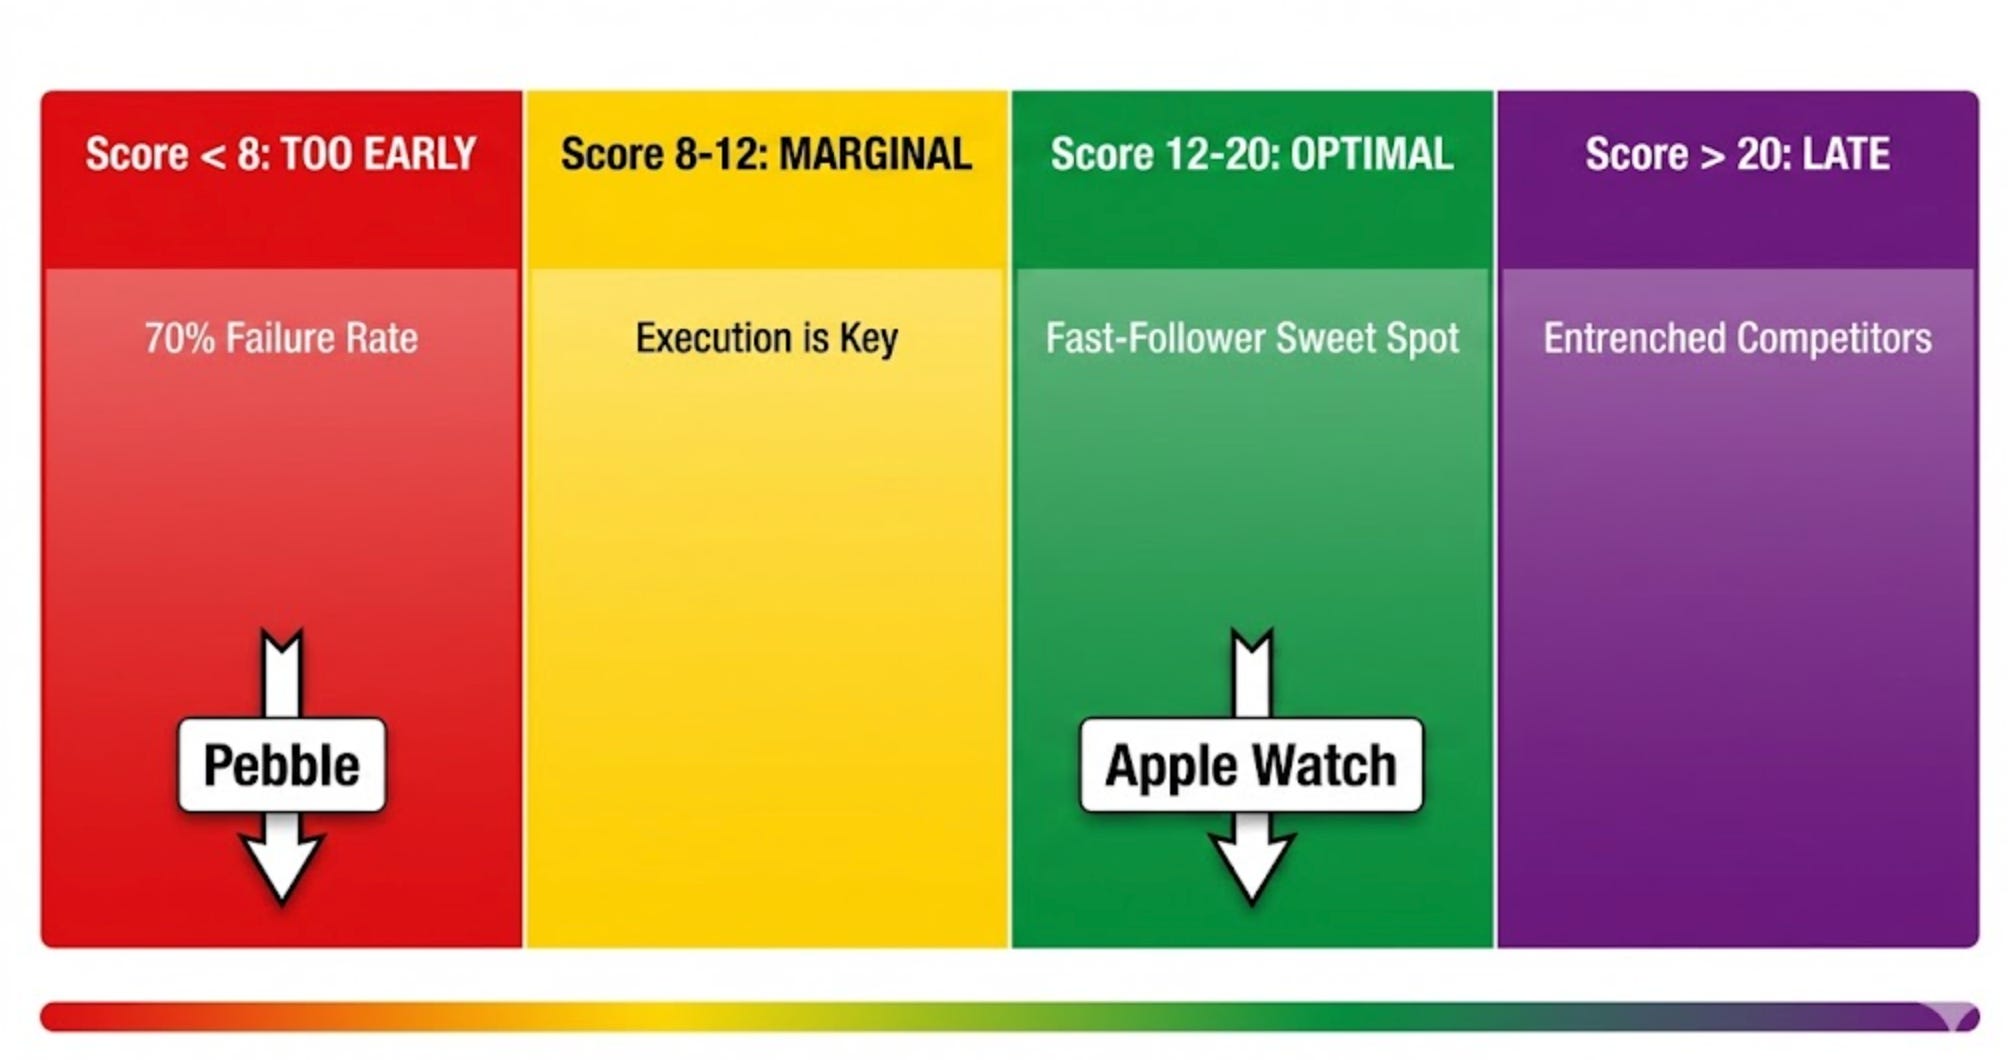
T-Score 8-12: Marginal Timing Zone
Execution quality becomes decisive.
Success rate: 45%.
Can win with exceptional product/GTM or fail despite doing many things right.
Examples: Google (1998 search entry, T-Score ~10-11), Facebook vs MySpace (both T-Score ~10-11, execution decided winner).
Strategic approach:
If entering this zone, recognize margin for error is slim. Product must be exceptional. GTM must be capital-efficient. Team must execute faster than competitors.
Not ideal for bootstrapped founders (too much risk), acceptable for well-capitalized VC-backed companies with 18-24 month runway.
T-Score 12-20: Optimal Fast-Follower Zone
Market ready, economics stable, defensibility present.
Success rate: 78%.
This is where you want to be.
Examples: Apple Watch (2015, T-Score 15-18), Notion (2016 productivity, T-Score 13-15), Figma (2016 design tools, T-Score 16-19).
Why they won:
First-movers had already educated market (customers understood “smartwatch” or “collaborative design”). CAC was predictable (channels proven). Differentiation possible (didn’t need to create category, just execute better). Capital-efficient scaling (no education burn tax).
T-Score > 20: Late Entry Zone
Market mature, competitors entrenched.
Success rate: 52% (better than too-early, worse than optimal timing).
Requires differentiation angle or superior resources.
Examples: Google Meet entering video conferencing in 2017 (T-Score ~22, late but Google brand/distribution enabled growth), Microsoft Teams entering team chat in 2017 (T-Score ~24, late but Office bundling created advantage).
Strategic approach:
If entering late, you need an unfair advantage: Brand (Google, Microsoft), distribution (bundling with existing product), or differentiation (10× better on specific dimension, new GTM motion like PLG where competitors use SLG).
Funding Model Thresholds: Different Capital Structures, Different Risk Tolerance
The same T-Score means different things depending on your funding model:
Bootstrapped Companies: Minimum T-Score 14+
Zero margin for education burn. Every dollar of CAC comes from personal savings or early revenue. Cannot afford 18-24 month market education cycles. Must enter ready markets only.
VC-Backed Companies: Minimum T-Score 10+
Capital buffer tolerates marginal timing if moat-building opportunity exists. 18-24 month runway allows for some market education if defensibility justifies it (DI >6/10).
Solopreneur/Lifestyle Businesses: Minimum T-Score 16+
Extreme efficiency required. Solo operator constraints (limited time, no team leverage) demand ready markets with proven playbooks. Cannot afford experimentation or education.
Angel/Pre-Seed: Minimum T-Score 12+
Between bootstrapped and VC risk tolerance. Some capital for market validation but not full education cycles.
Real Examples: T-Score in Action
Google (1998 Search Entry):
Market Readiness: 6.5/10 (Yahoo proved search demand, 2.4M websites existed, but category still maturing)
Defensibility: 5.8/10 (query data network effects building, but not obvious initially)
CAC Volatility: 35% (some channel learnings from Yahoo, but still volatile)
T-Score = (6.5 × 5.8) ÷ 0.35 = 37.7 ÷ 0.35 ≈ 10.8 (Marginal zone, execution decisive)
Outcome: Execution won. Superior algorithm + better user experience + capital-efficient growth = category domination despite late entry.
Pebble (2012 Smartwatch):
Market Readiness: 3.5/10 (smartphone integration immature, battery tech limited, no wearables ecosystem, customers unclear on value)
Defensibility: 6.2/10 (potential for developer ecosystem and brand, but unrealized)
CAC Volatility: 65% (very early market, no proven channels)
T-Score = (3.5 × 6.2) ÷ 0.65 = 21.7 ÷ 0.65 ≈ 5.3 (Too early, high failure risk)
Outcome: Died despite investments. Market readiness improved from 3.5 to 7.5 by 2015, but Pebble was out of runway. Apple entered at optimal timing.
Apple Watch (2015):
Market Readiness: 7.5/10 (Pebble/Fitbit educated market, HealthKit launched, customers understood wearables, infrastructure mature)
Defensibility: 8.3/10 (iPhone ecosystem lock-in, brand strength, health data network effects)
CAC Volatility: 28% (channels proven by Fitbit and Pebble pioneers, relatively stable)
T-Score = (7.5 × 8.3) ÷ 0.28 = 62.25 ÷ 0.28 ≈ 18.4 (Optimal zone, high success probability)
Outcome: Dominated. 50%+ market share within 18 months, maintained leadership through 2025. Perfect timing + execution.
Transition to Deep-Dive
Now you understand the T-Score formula and why it works. But to actually calculate your score, you need to measure the variables precisely.
The highest-leverage variable is Market Readiness (40% of timing success).
It requires systematic assessment. Most founders dramatically overestimate it. “We have 10 customers” doesn’t mean the market is ready for scaling when the category requires 10,000+ monthly search volume and 5-15 competitors for validation.
Below I’ll give you the exact 7-signal framework for calculating your Market Readiness Score with data sources, measurement protocols, and scoring rubrics.
It’s the most important 30-60 minutes you’ll spend on your timing decision.
Market Readiness - The 7-Signal Assessment Framework
Market Readiness is the single highest-leverage variable in the T-Score equation… explaining 40% of timing success according to sensitivity analysis.
Yet it’s the variable founders most frequently overestimate.
Market readiness isn’t about whether anyone will buy. It’s about whether enough customers understand the category, infrastructure exists to scale, and channels are stable enough for predictable economics.
The difference between MRS 5/10 (emerging) and MRS 8/10 (ready) is often the difference between $3,500 CAC with 9-month cycles versus $1,200 CAC with 3-month cycles.
That gap kills companies.
The 7-Signal Framework
Here’s how to objectively assess market readiness through quantifiable signals instead of founder optimism.
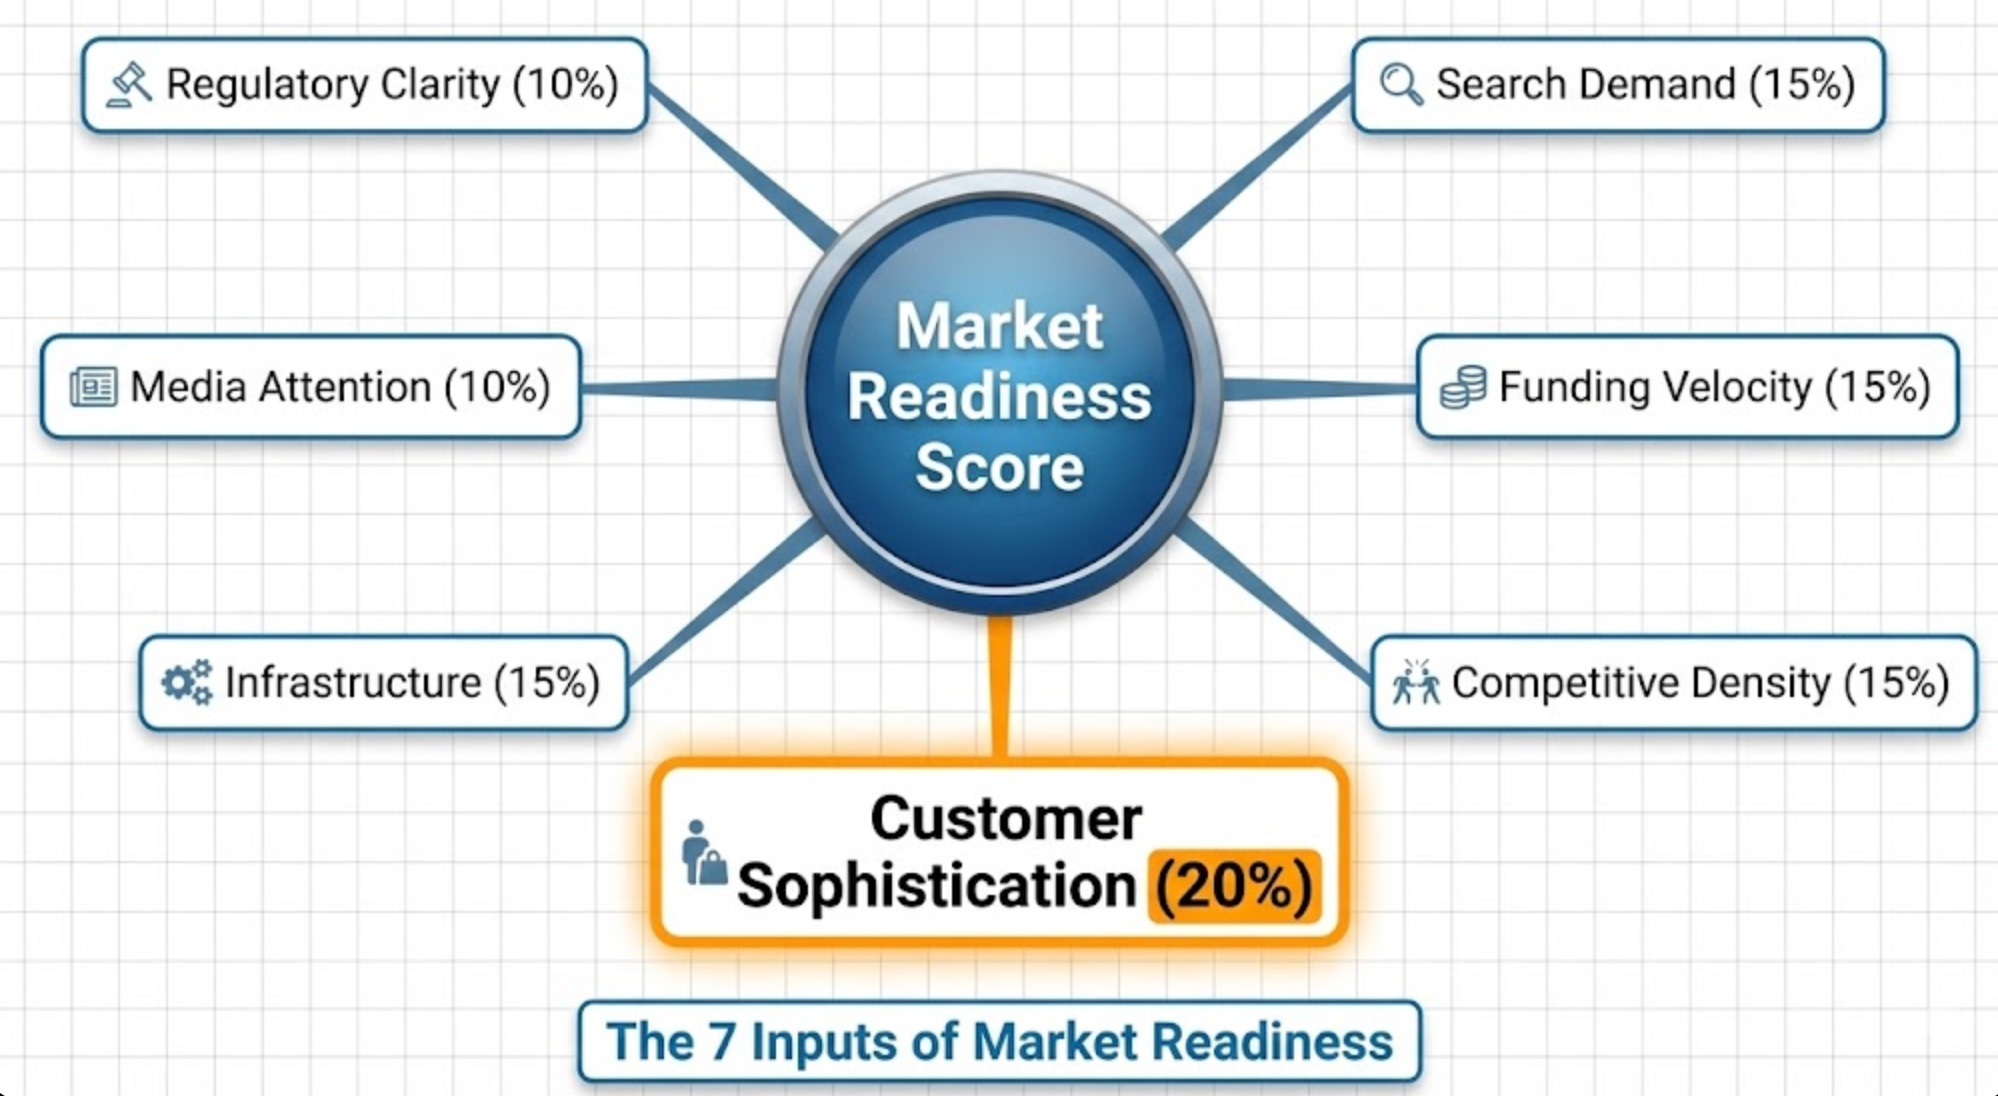
Signal 1: Search Demand Trends (Weight: 15%)
What it measures: Category awareness and demand trajectory.
Data source: Google Trends (free), Google Keyword Planner (free with Google Ads account), Ahrefs or SEMrush (optional, $99-199/month for precise volumes).
Measurement protocol:
Identify 3-5 category keywords (primary + variations). Example: “AI sales coaching,” “AI for sales,” “sales AI tools.”
Google Trends: Enter keywords, review 5-year trend, check “Rising” related queries.
Note current volume where available (Google Keyword Planner shows monthly search ranges).
Calculate 12-month growth rate.
Scoring criteria:
1-2/10: <500 monthly searches, flat or declining trend (too early, awareness minimal)
3-4/10: 500-2,000 searches, slow growth <20% YoY (emerging, still early)
5-6/10: 2,000-10,000 searches, moderate growth 20-50% YoY (growing awareness)
7-8/10: 10,000-50,000 searches, strong growth >50% YoY (approaching mainstream)
9-10/10: >50,000 searches, explosive growth >100% YoY or mature/saturating
Example: “AI sales coaching” (2024)
Monthly searches: ~8,200
YoY growth: +180%
Related queries: “AI for sales,” “sales AI tools,” “conversation intelligence” all rising
Score: 7/10 (strong growth, not yet mainstream but approaching)
Red flags: Flat or declining trends indicate category stagnation. Proceed only if you have a contrarian thesis for why demand will inflect.
Signal 2: Funding Velocity (Weight: 15%)
What it measures: Investor validation and competitive intensity.
Data source: Crunchbase (free basic, $29/month Pro for filtering), PitchBook (institutional), AngelList, manual research.
Measurement protocol:
Define category boundaries (specific enough to be meaningful: “AI sales coaching” not “AI software”).
Crunchbase search: Filter to category, last 12 months, count funded companies.
Track total funding volume (sum of all rounds).
Note stage distribution (mostly Seed = early, mix of Series A/B = maturing).
Scoring criteria:
1-2/10: 0-2 companies funded, <$5M total (too early, unvalidated by VCs)
3-4/10: 3-5 companies, $5-20M total (emerging thesis, early validation)
5-6/10: 6-10 companies, $20-100M total (VCs testing thesis actively)
7-8/10: 11-20 companies, $100-500M total (category heating, competitive but not saturated)
9-10/10: >20 companies, >$500M total (hot category, may be late/oversaturated)
Sweet spot: 5-15 funded companies indicate market validation without saturation.
Example: “AI sales coaching” (2024)
Companies funded (12 months): 14
Total funding: ~$180M
Distribution: 9 Seed, 4 Series A, 1 Series B
Score: 7/10 (healthy validation, not yet overcrowded)
Red flags: Zero funding might mean you’re too early OR category is bootstrapper-friendly and VCs aren’t interested (not necessarily bad). 30+ funded companies might mean you’re late unless you have strong differentiation.
Signal 3: Competitive Density (Weight: 15%)
What it measures: Category validation and saturation risk.
Data source: Product Hunt, G2, Capterra, market maps from VCs (Bessemer, a16z, Sequoia), manual Google/LinkedIn research.
Measurement protocol:
Identify all credible competitors (funded OR >$1M ARR OR recognizable brand, not vaporware).
Categorize by stage: Pre-revenue, early traction (<$1M ARR), growth ($1M-10M), mature (>$10M).
Assess market share concentration (one dominant player vs fragmented).
Scoring criteria:
1-2/10: 0-2 competitors (too early, you’re the pioneer, high risk)
3-4/10: 3-5 competitors (emerging, validation starting but still early)
5-6/10: 6-10 competitors (validation clear, space to differentiate)
7-8/10: 11-20 competitors (optimal for fast-follower, proven demand, differentiation possible)
9-10/10: >20 competitors (saturated unless strong differentiation/niche)
Sweet spot: 5-15 credible competitors = market validated, not yet saturated.
Example: “AI sales coaching” (2024)
Credible players: 12 with actual products and customers
Stage distribution: 6 early (<$1M), 4 growth ($1M-5M), 2 mature (>$5M)
Market share: Fragmented, no dominant leader
Score: 7.5/10 (ideal fast-follower density, validated but not saturated)
Red flags: 0-1 competitors might mean you’re too early OR you’ve found white space (validate through other signals). 30+ competitors means you need exceptional differentiation or niche focus.
Signal 4: Customer Sophistication (Weight: 20% - Highest Individual Weight)
What it measures: How much education customers need to buy.
Data source: Sales call recordings, customer discovery interviews, demo requests, support tickets.
Measurement protocol:
Review last 10-15 sales conversations (or customer interviews if pre-revenue).
Categorize questions: “What is this category?” (low sophistication) vs “How do you compare to Competitor X?” (high sophistication).
Track education time: How many hours to explain category concept before discussing your solution?
Note terminology usage: Do customers use category terms correctly?
Scoring criteria:
1-2/10: Customers ask “What is this?” Need 2+ hours category education. Blank stares when you describe a category.
3-4/10: Customers vaguely aware, need 1+ hour explaining category before discussing solution. Confused about value prop.
5-6/10: Customers understand the category exists, and need 30-45 min education on your specific approach. Some comparison shopping.
7-8/10: Customers actively evaluate solutions, understand the category well, and ask informed questions. Sales cycle <3 months.
9-10/10: Customers expert-level, compare features granularly, mention competitors unprompted. Sales cycle <1 month.
Example: “AI sales coaching” (2024)
Sales leaders mention AI sales tools in first call (aware of category)
Still need 30-45 min explaining our specific approach and differentiation
~60% actively comparing to 2-3 alternatives (active shopping behavior)
Score: 6.5/10 (aware but not yet expert, moderate education required)
This is the most important signal for B2B SaaS. Customer sophistication determines CAC and sales cycle length more than any other factor. If you’re scoring 3-4/10, expect education burn. Your CAC will be 2-4× higher than markets scoring 7-8/10.
Red flags: If customers need extensive education (1-2 hours on what the category is), you’re probably too early unless you have 18-24 months of runway and strong defensibility (DI >7/10) to justify the investment.
Signal 5: Infrastructure Maturity (Weight: 15%)
What it measures: Ecosystem readiness for scaling.
Data source: API documentation reviews, integration marketplaces (Zapier, Make), LinkedIn talent searches, complementary tool existence.
Measurement protocol:
Required infrastructure audit: What APIs, platforms, or tools must exist for your product to work? Are they mature and accessible?
Integration ecosystem check: How many pre-built integrations exist (Zapier directory, native integrations)?
Talent availability: LinkedIn search for domain expertise (e.g., “AI sales specialist” or “sales ops engineer”). 100+ profiles = talent pool exists.
Complementary tools: Do supporting tools exist (data sources, distribution channels, etc.)?
Scoring criteria:
1-2/10: Core infrastructure missing or immature. Must build a basic ecosystem from scratch. Talent pool nonexistent.
3-4/10: Some infrastructure exists but limited, few integrations, sparse talent.
5-6/10: Core infrastructure solid, some integrations available (5-10), growing talent pool.
7-8/10: Mature infrastructure, rich integrations (10-20+), experienced talent readily available.
9-10/10: Complete ecosystem, abundant integrations (50+), deep specialized talent pool, mature distribution channels.
Example: “AI sales coaching” (2024)
GPT-5/Claude APIs: Mature and accessible
CRM integrations: Salesforce, HubSpot, Pipedrive available
Recording tools: Gong, Chorus, Fireflies integrations possible
Talent: AI engineers abundant, sales ops expertise common
Score: 8/10 (strong infrastructure, rich ecosystem)
Red flags: If core infrastructure doesn’t exist (required APIs unavailable, no integration pathways, zero talent pool), you’ll spend 6-12 months building basic pipes instead of scaling. Proceed only if you have resources for infrastructure development.
Signal 6: Media Attention & Thought Leadership (Weight: 10%)
What it measures: Mainstream awareness and discussion momentum.
Data source: TechCrunch, VentureBeat, industry publications, conference agendas, podcast episode tracking, LinkedIn/Twitter discussion volume.
Measurement protocol:
Google News search: “[Category]” + “software/tools/platform,” count articles last 12 months.
Conference presence: Major industry conferences (SaaStr, Web Summit, industry-specific) have dedicated tracks/sessions?
Thought leadership: Blogs, podcasts, courses specifically about category emerging?
Social discussion: LinkedIn posts with category hashtags getting engagement (100+ likes/comments)?
Scoring criteria:
1-2/10: No media coverage, no conference mentions, scattered/isolated social discussion.
3-4/10: Occasional articles (2-5/year), no dedicated conference presence, limited social buzz.
5-6/10: Regular coverage (6-15 articles/year), emerging as conference topic, growing social discussion.
7-8/10: Frequent coverage (15-30 articles/year), dedicated conference tracks, active LinkedIn/Twitter discussion.
9-10/10: Category saturating media (50+ articles/year), multiple annual conferences, constant social discussion.
Example: “AI sales coaching” (2024)
TechCrunch coverage: 8 articles last 12 months
SaaStr/Sales conferences: Adding AI/sales automation tracks
Sales podcasts: Regular episodes on AI for sales teams
LinkedIn engagement: Category content getting 200-500+ reactions
Score: 7/10 (strong and growing attention, not yet saturated)
Red flags: Zero media coverage and no conference buzz might mean you’re too early. However, some B2B categories can have customer readiness without media hype (industrial/niche sectors), so weight this signal lower for unsexy categories.
Signal 7: Regulatory Clarity (Weight: 10%)
What it measures: Legal/compliance framework clarity and risk.
Data source: Industry association announcements, regulatory body guidance (SEC, FDA, FCC depending on category), legal blog analysis, compliance framework documentation.
Measurement protocol:
Framework assessment: Is regulatory approach to category defined (yes) or uncertain (no)?
Compliance requirements: Are pathways to compliance clear and documented?
Legal precedents: Have legal challenges been resolved with precedent-setting cases?
Regulatory trends: Is regulation supportive (encouraging innovation), restrictive (limiting activity), or evolving (uncertain)?
Scoring criteria:
1-2/10: No regulatory framework, high legal uncertainty, potential for category to be restricted/banned.
3-4/10: Regulations emerging but unclear, legal battles ongoing, compliance path uncertain.
5-6/10: Framework developing, some clarity emerging, regulatory direction becoming clearer.
7-8/10: Clear regulations established, compliance paths well-documented, precedents set.
9-10/10: Mature regulatory environment, established compliance industry, clear legal boundaries.
Example: “AI sales coaching” (2024)
General AI regulations: EU AI Act emerging (some uncertainty)
Sales coaching industry: Lightly regulated (unlike healthcare/fintech)
Data privacy: GDPR/CCPA apply but well-understood for SaaS
Call recording: State-by-state laws clear (two-party consent requirements understood)
Score: 6/10 (sufficient clarity for B2B SaaS, some AI regulatory uncertainty)
Critical for: Healthcare, fintech, crypto, education (Title IX), real estate, legal services, cannabis, anything touching children. Proceed with caution if regulatory score <4/10 unless you have legal expertise and capital for regulatory navigation.
Less critical for: Standard B2B SaaS, productivity tools, consumer social (unless touching children/health). Weight this signal lower if category isn’t heavily regulated.
Composite Market Readiness Score Calculation
Methodology: Calculate weighted average across 7 signals OR simple average if weighting feels too complex for initial assessment.
Weighted Formula:
MRS = (Signal 1 × 15%) + (Signal 2 × 15%) + (Signal 3 × 15%) + (Signal 4 × 20%) + (Signal 5 × 15%) + (Signal 6 × 10%) + (Signal 7 × 10%)
Simple Formula:
MRS = (Signal 1 + Signal 2 + Signal 3 + Signal 4 + Signal 5 + Signal 6 + Signal 7) ÷ 7
AI Sales Coaching Complete Example (Simple Average):
Signal 1 (Search Trends): 7/10
Signal 2 (Funding Velocity): 7/10
Signal 3 (Competitive Density): 7.5/10
Signal 4 (Customer Sophistication): 6.5/10
Signal 5 (Infrastructure): 8/10
Signal 6 (Media Attention): 7/10
Signal 7 (Regulatory Clarity): 6/10
MRS = (7 + 7 + 7.5 + 6.5 + 8 + 7 + 6) ÷ 7 = 49 ÷ 7 = 7.0/10
Interpretation: MRS 7.0 indicates a ready, growing market. Category validated by competitors (Signal 2-3), infrastructure mature (Signal 5), awareness building (Signal 1, 6). Customer sophistication moderate (Signal 4 at 6.5) means some education still required but not starting from zero.
This MRS feeds into T-Score formula as the Market Readiness variable.
Quick vs Comprehensive Versions
Quick Version (30-45 minutes):
Estimate each signal based on: Google Trends check (5 min), quick Crunchbase search (5 min), competitor Google search (5 min), sales conversation recall (10 min), educated guesses on infrastructure/media/regulatory (5 min each).
Acceptable accuracy: ±1 point from comprehensive score (Quick MRS 6.8 vs Comprehensive 7.2 both indicate “ready market”).
Use for: Monthly tracking, directional decisions, preliminary assessment.
Comprehensive Version (2-3 hours):
Systematic data gathering: Precise search volume data, complete Crunchbase analysis, thorough competitor mapping, sales conversation analysis (transcripts), infrastructure audit, media/conference deep research, regulatory framework review.
Board-presentation-grade validation.
Use for: Major decisions (launch, pivot, fundraising), quarterly deep reassessment, investor presentations.
Strategic recommendation: Start with Quick version Week 1 for immediate direction. Upgrade to Comprehensive version Week 2-3 before making major capital allocation decisions.
Category-Specific Adjustments
B2B SaaS:
Weight Signal 4 (Customer Sophistication) higher at 25% (longer sales cycles make education burden critical).
Weight Signal 6 (Media Attention) lower at 5% (conference buzz less important than customer conversations).
Consumer Apps:
Weight Signal 1 (Search Demand) and Signal 6 (Media/Social Buzz) higher (consumer awareness crucial, viral mechanics).
Weight Signal 2 (Funding Velocity) lower at 10% (VC validation less correlated with consumer readiness).
Marketplaces:
Add Signal 8 (Supply-Side Readiness): Are suppliers/creators available and sophisticated? Critical for two-sided markets.
Average 8 signals for comprehensive marketplace MRS.
Regulated Industries (Healthcare, Fintech):
Weight Signal 7 (Regulatory Clarity) higher at 20% (compliance blockers kill scaling).
Don’t launch if Signal 7 <5/10 unless you have regulatory expertise and 18+ month runway.
Integration with T-Score
You now have your Market Readiness Score (MRS) feeding into the T-Score formula as the highest-leverage variable (40% impact on timing success).
Next, we need to assess Defensibility—the second major T-Score component that determines whether you should pursue a first-mover or fast-follower strategy.
Announcement…
I have put up two of my most loved GTM systems “LinkedIn Profile Upgrade for 8x Visibility: AI Thought Leadership Transformation System”, “The Thought Leadership System: Build B2B Authority in 30 Days” on heavy discount... especially for you guys.
Checkout on the links below for the offers.
LinkedIn Profile Upgrade for 8x Visibility: AI Thought Leadership Transformation System
The Thought Leadership System: Build B2B Authority in 30 Days
Defensibility - The Three-Moat Framework
Market Readiness tells you WHEN the market is ready.
Defensibility tells you WHETHER you should be first or follow.
Here’s the strategic insight most founders miss: High defensibility with low market readiness means “wait and build” (Apple Watch strategy). Low defensibility with high market readiness means “fast-follower efficiency” (Google search strategy).
The combination determines your timing strategy more than either variable alone.
Defensibility measures: Can a first-mover build sustainable competitive advantages (moats) that prevent fast-follower success?
If defensibility is high (8+/10), being first matters. You can capture network effects, switching costs, or brand advantages before fast-followers arrive.
If defensibility is low (3-5/10), being first is often a disadvantage. You pay for market education but can’t defend against better-capitalized or better-executed fast-followers.
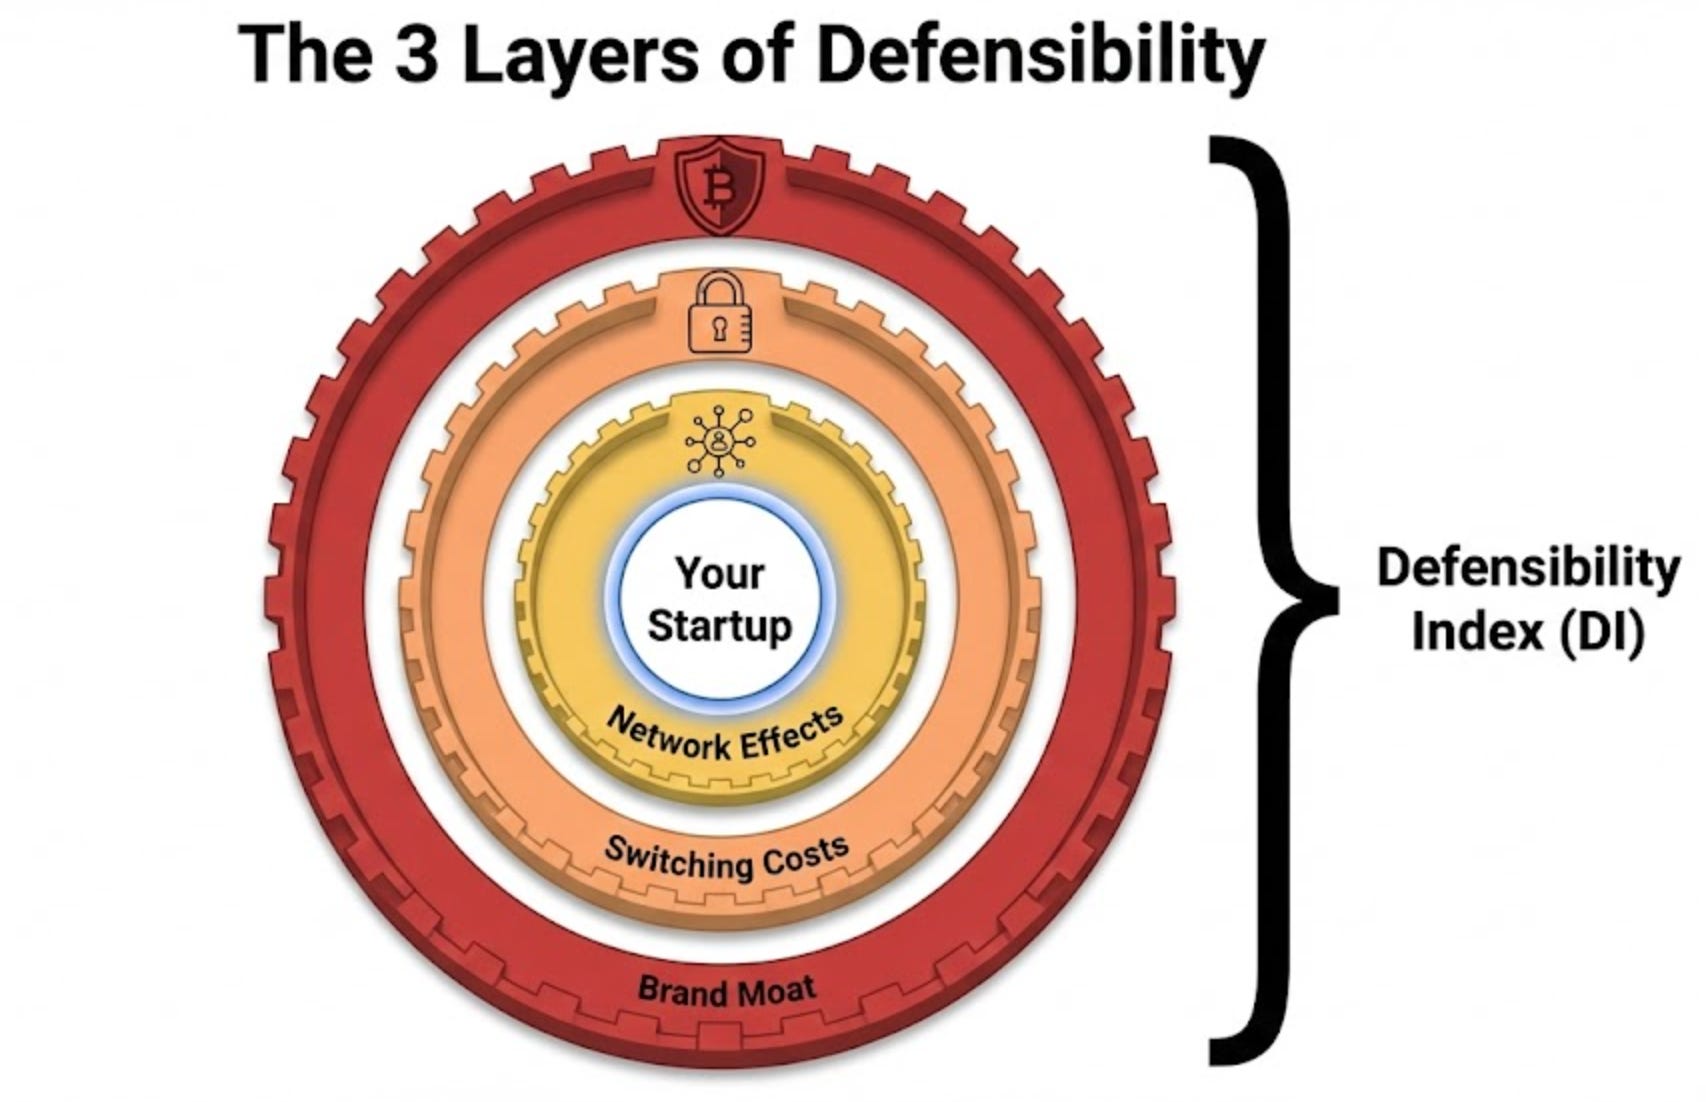
The Three Moat Categories
Moat 1: Network Effects (Max Score: 10/10)
Definition: Product value increases with more users, creating compounding advantage and winner-take-most dynamics.
Assessment framework:
Direct Network Effects (Score 7-10/10):
Every new user makes product more valuable for ALL existing users
Examples: Social networks (LinkedIn, Facebook), communication platforms (Slack, WhatsApp), marketplaces (eBay, Uber, Airbnb)
Scoring: Score 9-10/10 if you’re building a two-sided marketplace with liquidity effects OR social network with connection value. Score 7-8/10 if network effects are strong but not winner-take-all (B2B networks).
Data Network Effects (Score 5-7/10):
Product improves with usage data, creating accuracy/quality advantages
Examples: Google (search queries improve algorithm), Waze (driver data improves routing), Grammarly (writing corrections improve suggestions)
Scoring: Score 6-7/10 if proprietary data creates meaningful product improvement. Score 4-5/10 if data advantage is modest or slow to compound.
Ecosystem/Platform Effects (Score 5-8/10):
Third-party developers/partners build on your platform, creating ecosystem lock-in
Examples: Salesforce (AppExchange), Shopify (apps/themes), Zapier (integrations)
Scoring: Score 7-8/10 if you’re building a platform with developer network effects. Score 5-6/10 if ecosystem effects are modest (some integrations but not platform strategy).
Weak/No Network Effects (Score 1-4/10):
Product value independent of user count, or network effects are indirect/weak
Examples: Most SaaS tools (project management, analytics, CRM for SMB), productivity apps, content creation tools
Scoring: Score 3-4/10 if some weak network effects exist (team collaboration has minor network value). Score 1-2/10 if product value is entirely independent of user count.
Measurement test: If your product works just as well for user #1 as user #1,000,000, you have weak network effects. If it’s dramatically better at scale, you have strong network effects.
AI Sales Coaching Example:
Team collaboration: Minor network effects (shared insights across sales team)
No marketplace dynamics (not connecting buyers/sellers)
Data effects: Moderate (call analysis improves with volume, but not winner-take-all)
Network Effects Score: 3/10 (weak, commodity risk high)
Moat 2: Switching Costs (Max Score: 10/10)
Definition: Time, money, or friction required for customers to migrate to competitor. High switching costs = retention moat.
Assessment framework:
Data Lock-In (Score 7-10/10):
Customers accumulate significant proprietary data in your system, migration is painful/expensive
Examples: CRM systems (Salesforce with years of customer data), ERP (SAP with operational data), analytics platforms (historical data loss on migration)
Measurement: Would migrating require months of work or data export/transformation? If yes, score 8-10/10. If easy export, score 3-5/10.
Integration Depth (Score 5-8/10):
Your product deeply integrated into customer workflows, infrastructure, or tech stack
Examples: Payment processors (Stripe integrated into entire billing system), authentication (Auth0 woven into product), communication APIs (Twilio embedded in customer notifications)
Measurement: How many hours to rip out your product and replace with competitor? >80 hours = score 7-8/10. <20 hours = score 3-4/10.
Training & Adoption Investment (Score 4-7/10):
Customers invest significant time training teams, building workflows, or establishing processes around your product
Examples: Enterprise software with extensive training programs, complex productivity tools with learning curves
Measurement: How many hours did customer spend on training/adoption? >40 hours across team = score 6-7/10. <10 hours = score 2-3/10.
Contractual Lock-In (Score 3-6/10):
Annual contracts, MSAs, or penalty clauses create switching friction
Note: This is the weakest switching cost (expires eventually, doesn’t prevent churn long-term)
Measurement: Contract length and switching penalties. Multi-year enterprise contracts = 5-6/10. Monthly self-serve = 1-2/10.
Low Switching Costs (Score 1-3/10):
Customer can migrate in hours/days with minimal data loss or disruption
Examples: Simple productivity tools, lightweight SaaS with easy export, commodity services
Measurement: If customer can switch to competitor in <5 hours of work, score 1-3/10.
Measurement test: Ask: “What would it take for our best customer to switch to a competitor tomorrow?”
If the answer is “just cancel subscription and sign up elsewhere,” you have low switching costs (1-3/10).
If the answer is “months of data migration, team retraining, and workflow disruption,” you have high switching costs (8-10/10).
AI Sales Coaching Example:
Data lock-in: Moderate (call transcripts and analysis history valuable but not mission-critical)
Integration depth: Low (integrates with CRM/recording tools but not deeply embedded)
Training investment: Moderate (30-45 min onboarding per user, some workflow adoption)
Switching Costs Score: 5/10 (moderate friction, not high enough for strong moat)
Moat 3: Brand Moat (Max Score: 10/10)
Definition: Brand recognition, trust, and category name ownership that drives customer preference and reduces acquisition costs.
Assessment framework:
Category Name Ownership (Score 8-10/10):
Your brand IS the category name in customer minds
Examples: “Google it” (search), “Uber ride” (rideshare), “Slack me” (team chat), “Zoom call” (video conferencing)
Measurement: Do customers use your brand as a verb or generic category reference? Survey 50 target customers: “What do you call [category]?” If >50% say your name, score 9-10/10.
Trust/Reputation Moat (Score 5-8/10):
Customers choose you based on brand trust, industry reputation, or compliance/security credibility
Examples: Security companies (Cloudflare, Okta), financial services (Stripe, Plaid), enterprise software with compliance needs
Measurement: Do customers cite “trust in brand” as top-3 buying reason in sales conversations? Survey post-sale: Why did you choose us? If “brand trust” is top response, score 7-8/10.
Community/Movement Moat (Score 5-7/10):
Strong community around product creates belonging and loyalty
Examples: Notion (passionate user community), Figma (design community), Replit (developer community)
Measurement: Active community (Slack, Discord, forum)? User-generated content (templates, tutorials, courses)? If yes and growing, score 6-7/10.
Weak Brand (Score 1-4/10):
Generic positioning, interchangeable with competitors, brand doesn’t drive buying decisions
Examples: Most early-stage startups, commodity services, generic “us too” SaaS in crowded categories
Measurement: In sales conversations, do customers ask “how are you different from X?” without knowing who you are? If yes, score 1-3/10 (still building brand).
Measurement test: Run a blind comparison test. Show target customers feature lists of you and top competitor without brand names.
If they can’t tell you apart, you have weak brand (1-3/10).
If they specifically want your brand even with similar features, you have strong brand (7+/10).
AI Sales Coaching Example:
Category name: “AI sales coaching” is generic (no brand owns it yet)
Trust: Early, no established reputation advantage
Community: No movement or passionate community yet
Brand Moat Score: 2/10 (early-stage, no brand advantage)
Composite Defensibility Index (DI) Calculation
Formula:
DI = (Network Effects + Switching Costs + Brand Moat) ÷ 3
AI Sales Coaching Example:
Network Effects: 3/10
Switching Costs: 5/10
Brand Moat: 2/10
DI = (3 + 5 + 2) ÷ 3 = 10 ÷ 3 = 3.3/10
Interpretation: Low defensibility. This is a fast-follower category, not a first-mover opportunity. Commoditization risk is high.
Strategic implication: Don’t spend years educating market as first-mover. Let others do that, then enter with superior execution and capital efficiency.
Strategic Implications by DI Score
DI 8-10/10 (High Defensibility): First-mover advantage CAN exist if you move fast and capture moat before competition.
Strategy: Enter early (even if MRS is 5-6/10), invest in moat-building (network effects, ecosystem, brand)
Acceptable T-Score: Lower threshold (8-10 acceptable for VC-backed companies)
Timeline: 18-24 months to build moat, then scale
Examples: Uber (marketplace liquidity), Slack (brand + network effects), Salesforce (ecosystem + switching costs)
DI 5-7/10 (Moderate Defensibility): First-mover advantage exists but not overwhelming. Execution quality decisive.
Strategy: Enter when MRS 6-7/10 (not too early, not too late), focus on building one strong moat (usually brand or switching costs)
Acceptable T-Score: Standard threshold (12+ for bootstrapped, 10+ for VC)
Timeline: 12-18 months to establish position
Examples: Notion (brand + community moat), Figma (switching costs through files + brand)
DI 3-5/10 (Low Defensibility): Fast-follower advantage dominates. Being first is often a disadvantage.
Strategy: Wait for MRS 7-8/10 (let pioneers educate), enter with capital efficiency and superior execution
Acceptable T-Score: Higher threshold (14+ for bootstrapped, 12+ for VC)
Timeline: 6-12 months to PMF, optimize for profitability over market share
Examples: Google (search commoditized, won on execution), project management tools (multiple winners, execution-driven)
DI 1-3/10 (Commoditized): No moat opportunity. Compete on price, execution, or niche positioning.
Strategy: Extreme capital efficiency, vertical-specific niche, or avoid category entirely
Acceptable T-Score: Very high threshold (16+ required, market must be extremely ready)
Timeline: 3-6 months to profitability or pivot
Examples: Many AI wrappers (2023 ChatGPT integration plays, commoditized fast)
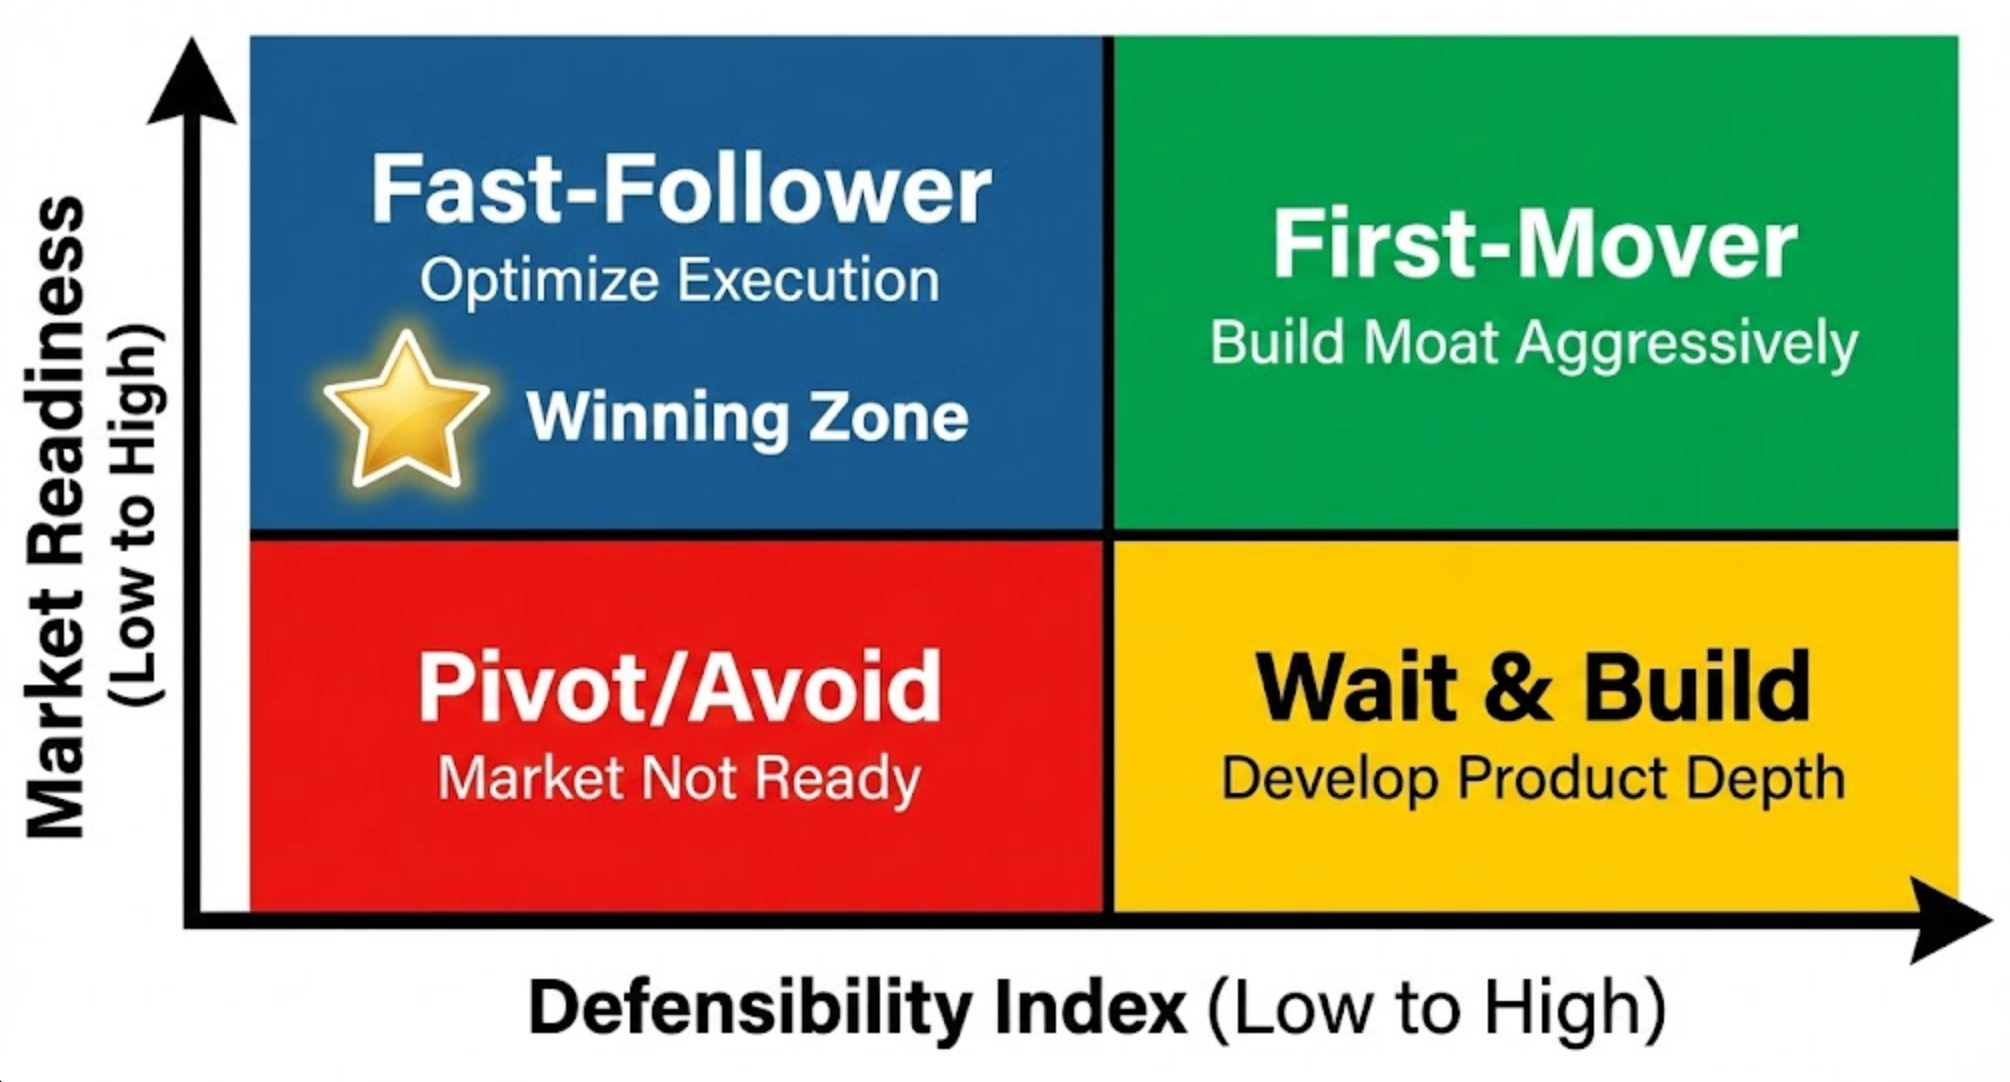
First-Mover vs Fast-Follower Decision Matrix
Now combine Defensibility (DI) with Market Readiness (MRS) to determine your strategic positioning.
Quadrant 1 (High DI 7+, High MRS 7+): First-Mover Optimal
Market is ready AND you can build moats → Move aggressively, capture network effects/switching costs/brand before competition
Example: If Uber launched today with marketplace mechanics proven (high MRS) and strong liquidity moats (high DI), first-mover makes sense
Resource allocation: 60% product/engineering (build moat), 40% GTM (establish presence)
Quadrant 2 (High DI 7+, Low MRS 3-6): Wait & Build
You can build moats BUT market isn’t ready → Wait for market maturation, use time to build product depth and positioning
Example: Apple Watch waited until MRS improved from 3.5 (Pebble era) to 7.5 (2015), used time to build iOS ecosystem integration
Resource allocation: 70% product (build depth), 30% market education content (help market mature)
Quadrant 3 (Low DI 3-5, High MRS 7+): Fast-Follower Optimal
Market is ready BUT low defensibility → Let first-movers educate, enter with capital efficiency and execution focus
Example: Google entering search (Yahoo educated market, Google won on execution with similar T-Score timing)
Resource allocation: 40% product (good enough), 60% GTM (efficient scaling, optimize CAC)
Quadrant 4 (Low DI 3-5, Low MRS 3-6): Avoid or Pivot
Market not ready AND can’t build moats → High risk, consider pivoting to better-timed category
Example: Many mobile commerce apps 2010-2012 (market unready, no moat opportunity)
Resource allocation: If proceeding, 50/50 product and market validation with tight budget constraints, plan for pivot
AI Sales Coaching Positioning:
DI: 3.3/10 (Low)
MRS: 7.0/10 (High)
Quadrant: Q3 Fast-Follower Optimal
Strategy: Let current competitors educate market, enter with superior execution (better UI, pricing, or vertical focus), optimize for capital efficiency over market share
Resource allocation: 40% product excellence, 60% efficient GTM (goal: 3-10× better CAC than first-movers)
First-Mover vs Fast-Follower Decision Matrix (Visual Tool)
[Download visual 2×2 matrix tool - coming soon]
This is a visual 2×2 matrix plotting:
X-axis: Defensibility Index (1-10)
Y-axis: Market Readiness Score (1-10)
How to use:
Calculate your MRS (Section 2)
Calculate your DI (Section 3)
Plot position on matrix
Read quadrant playbook
Align resource allocation to strategic prescription
This visual tool makes strategy discussions with co-founders, team, or board instantly clearer: “We’re Q3 i.e. validated market, low defensibility. We optimize for efficiency, not land-grab.”
Now that you understand WHERE you should position (first-mover vs fast-follower), let’s validate the framework through historical case studies showing these patterns in action.
Case Study Patterns - Historical Validation
Theory is useful. But you want proof the T-Score framework actually predicts outcomes.
Here are case study pairs showing how timing and defensibility determined winners and losers across different categories.
Case 1: Google vs Yahoo - The 4.5-Year Fast-Follower Win
Category: Web search (1994-2004)
Yahoo (1994 Launch):
Market Readiness: 1.5/10 (only 3,000 websites existed, users learning what “search” meant, no keyword advertising yet, dial-up internet constraints)
Defensibility: 4.3/10 (brand advantage building, but directory model had weak network effects, no data moat initially)
CAC Volatility: 65%+ (very early market, no proven channels, heavy education spend)
Calculated T-Score: (1.5 × 4.3) ÷ 0.65 = 6.45 ÷ 0.65 ≈ 3.2 (Too early)
Cost of being first:
Spent estimated $50M+ educating market on search (1994-1998)
CAC: $15-30 per user (explaining what search engines do, why web directories matter)
Built infrastructure from scratch (crawler technology, server farms)
Cycled through multiple business models before finding keyword advertising
Google (1998 Launch - 4.5 years later):
Market Readiness: 6.5/10 (Yahoo proved search demand, 2.4M websites existed, users understood search behavior, keyword ads emerging as model)
Defensibility: 5.8/10 (query data network effects becoming clear, algorithmic advantage, PageRank innovation)
CAC Volatility: 35% (Moderate. some channel learnings from Yahoo, still volatile but improving)
Calculated T-Score: (6.5 × 5.8) ÷ 0.35 = 37.7 ÷ 0.35 ≈ 7.0 (Marginal zone, execution decisive)
Advantage of following:
Zero market education cost (Yahoo spent 4.5 years teaching search behavior)
CAC: $2-5 per user (10× more efficient. Users already understood search, just comparing quality)
Learned from Yahoo’s directory mistakes (algorithmic search > human curation at scale)
Entered when revenue model (keyword advertising) was proven by GoTo.com/Overture
Outcome:
Google reached $1B revenue in 2003 (5 years post-launch)
Yahoo peaked around $7B revenue but never dominated search
By 2010, Google commanded 65%+ search market share globally
Yahoo sold to Verizon for $4.5B in 2017 (far below peak value)
Lesson: Being 4.5 years “late” wasn’t a disadvantage, it was a 10× CAC efficiency advantage.
Yahoo’s first-mover investment educated the market for Google’s benefit. Google’s superior execution (PageRank algorithm, clean UI, AdWords innovation) won in a marginal T-Score environment where timing was similar but execution was decisive.
Case 2: Jasper vs ChatGPT - The AI Compression Effect
Category: AI writing assistants (2021-2024)
Jasper (February 2021 Launch):
Market Readiness: 4.2/10 (GPT-3 API just launched July 2020, awareness low, “AI writing” foreign concept to most marketers, infrastructure early)
Defensibility: 3.8/10 (API wrapper on OpenAI, limited moat potential, low switching costs)
CAC Volatility: 55% (early market, experimenting with channels)
Calculated T-Score: (4.2 × 3.8) ÷ 0.55 = 15.96 ÷ 0.55 ≈ 5.4 (Too early)
Jasper’s journey:
Raised $125M Series A (Oct 2022) at $1.5B valuation
Grew to $40M ARR by mid-2022 (21 months post-launch)
Spent $20-30M educating market on “what is AI writing?” through content, ads, partnerships
CAC in 2021-2022: Estimated $150-300 (high education burden)
Then ChatGPT launched (November 2022):
OpenAI released ChatGPT to public
Reached 100M users in 8 weeks (fastest adoption in internet history)
Completed market education for AI writing category essentially overnight
Suddenly every marketer understood “AI writing” concept without Jasper’s education investment
Market dynamics post-ChatGPT:
Market Readiness: Jumped from 4.2/10 to 8.5/10 in 8 weeks (ChatGPT effect)
Competitive response: 50+ AI writing tools launched Q1 2023 (fast-follower flood)
Pricing pressure: $99/mo (Jasper’s price) became unsustainable as free/cheap alternatives emerged
Jasper’s response: Raised additional capital, pivoted to enterprise focus, but growth slowed dramatically
The AI compression insight:
Traditional categories (2010s SaaS): 36-month fast-follower window. Jasper had 21 months as effective first-mover before ChatGPT.
AI-era categories: 6-12 month fast-follower window. Platforms (OpenAI, Google, Microsoft) can complete market education in weeks through distribution advantages.
Lesson: Jasper’s T-Score 5.4 (too early) meant they paid education tax.
But unlike traditional categories where pioneers could convert education investment into moat before fast-followers arrived, AI compression meant a platform (OpenAI) could commoditize their 21-month investment in 8 weeks.
The fast-follower window compressed from 36 months → 6 months.
Timing precision is now measured in months, not years.
2025 implication: If you’re first-mover in an AI category with T-Score <8, you’re at risk of a platform (OpenAI, Google, Anthropic, Microsoft) completing market education and commoditizing your category overnight.
Defensibility must be exceptionally high (DI >8/10) to justify early entry in AI categories.
Case 3: Notion - The Perfect Fast-Follower
Category: Productivity/collaboration tools (2016 Launch, but public release 2018)
Context: Productivity was mature category. Evernote (2008), OneNote (2003), Confluence (2004), Google Docs (2006) had educated market. Notion entered a validated but fragmented market.
Notion (2018 Public Launch):
Market Readiness: 7.8/10 (customers understood productivity tools, infrastructure mature, distribution channels proven, competitive landscape fragmented)
Defensibility: 5.2/10 (Moderate, some switching costs through notes/database migration, community building, but not network effects)
CAC Volatility: 32% (mature market with proven channels, relatively stable)
Calculated T-Score: (7.8 × 5.2) ÷ 0.32 = 40.56 ÷ 0.32 ≈ 13.5 (Optimal fast-follower zone)
Notion’s fast-follower advantages:
Zero market education (Evernote spent 2008-2016 teaching “digital note-taking”)
Learned from predecessor mistakes (Evernote’s cluttered UI, OneNote’s Microsoft lock-in, Confluence’s complexity)
Entered with product differentiation (blocks-based editor, databases, all-in-one workspace)
Leveraged new GTM motion (PLG, freemium, community-led growth vs Evernote’s traditional SaaS sales)
Execution strategy:
Product excellence (loved by early adopters, NPS 60+)
Community building (templates, tutorials, ambassador program)
PLG motion (free tier with viral mechanics, sharing workspaces)
Capital efficiency (raised only $10M Seed before reaching scale)
Outcome:
Reached $100M ARR by 2021 (3 years post-public launch)
$10B valuation (2021)
Estimated $300M-400M ARR by 2024
Dominated Evernote (whose valuation fell from $1B in 2012 to <$200M)
Lesson: T-Score 13.5 (optimal fast-follower zone) predicted success.
Notion didn’t need to be first. They needed to be better with optimal timing.
Ready market (7.8/10 MRS) + moderate defensibility (5.2/10 DI) + stable economics (32% CV) = perfect conditions for execution-focused fast-follower.
They won through product quality and new GTM motion (PLG), not timing advantage.
Pattern Synthesis
These case studies validate T-Score predictions:
Too Early (T-Score <8):
Yahoo (3.2): Survived but never dominated search, 10× worse CAC than Google
Jasper (5.4): Paid education tax, then got commoditized by platform
Marginal (T-Score 8-12):
Google (7.0): Won through superior execution (PageRank, AdWords)
Optimal (T-Score 12-20):
Notion (13.5): Perfect fast-follower success
Key insight: The T-Score framework correctly predicted outcomes across categories, time periods, and company types.
Too-early companies paid education tax and failed or struggled. Optimal-timing companies succeeded through execution. Marginal-timing companies saw execution become decisive.
Too Early Tax vs Too Late Penalty - The Economics of Bad Timing
The case studies showed WHAT happened. Now let’s quantify HOW MUCH bad timing costs.
→ Download full economic analysis study
Your Timing Playbook - Week 1 Implementation Roadmap
You’ve seen the framework (Section 1), learned to measure Market Readiness (Section 2) and Defensibility (Section 3), validated through case studies (Section 4), and understood the economic costs of bad timing (Section 5).
Now let’s make this immediately actionable.
Here’s your Week 1 roadmap to go from “should we launch now or wait?” strategic paralysis to “here’s our data-driven timing decision” clarity.
→ Get the complete Implementation Roadmap
Conclusion: Timing Isn’t Luck. It’s Measurable Science
Market timing has always felt like founder intuition, gut feel, or luck.
But it’s not.
Timing is quantifiable through three variables: Market Readiness Score, Defensibility Index, and CAC Volatility.
The T-Score framework gives you a systematic way to answer the question that kills companies: “Should we launch now or wait?”
The data is clear:
T-Score <8: Too early, 70%+ failure rate
T-Score 12-20: Optimal timing, 78% success rate
Being 2-4 years “late” is often a 10× CAC efficiency advantage
The pioneers who educated the market rarely win.
The fast-followers who entered at optimal timing dominate.
Use this framework. Calculate your score. Make your timing decision with data, not hope.
Your next steps:
Calculate your preliminary T-Score (10 minutes)
Complete the 7-signal Market Readiness assessment (30-60 minutes)
Evaluate your Defensibility Index (20 minutes)
Plot your position on the decision matrix
Align your strategy with your quadrant
Timing isn’t luck.
It’s measurable science.
Now you have the formula.
Loved this post?
And subscribe to “Prompts Daily Newsletter” as well…
If you’re not a subscriber, here’s what you missed earlier:
The Viral LinkedIn GTM Playbook: Frameworks That Drove Engagement and Leads
The Offer Testing Matrix: 6 B2B Hooks That Convert Cold Prospects into Pipeline
Distribution Before Product: The Operator’s 90-Day GTM Playbook - With Prompts
Nathan Latka SaaS Playbook - 34 Growth Tactics, 15 Growth Hacks and AI Prompts (Part 1 of 2)
Subscribe to get access to the latest marketing, strategy and go-to-market techniques . Follow me on Linkedin and Twitter.

This article comes at the perfect time, I was just re-visiting your 'Growth Assessment' earlier this week and thinking about timing. The breakdown of the T-Score and MRS into actionable steps is so brilliant, definetely super helpful for any founder trying to navigate this complex space.