Guide to creator-led growth: Zero Cost and No Pitching
Stop asking creators to share your content. This playbook reveals why companies like Gong became upstream idea sources that creators proactively cite, while everyone else got nothing.

I spent most of 2022 DMing creators asking them to share our content.
Response rate: 4%. Share rate: 0%.
Then I watched what actually worked.
Kyle Poyar’s growth threads hit millions of impressions. Lenny Rachitsky drives more enterprise demos than most paid campaigns. Elena Verna’s frameworks get cited in board decks.
None of them are sharing your content because you asked nicely.
They’re sharing Gong’s benchmarks. Reforge’s analyses. First Round’s research.
The difference: these companies became upstream idea sources—producing insights creators can’t ignore.
Most B2B companies chase creator partnerships backwards. They pitch collaborations. They offer payment. They send product demos.
All value extraction signals.
The companies earning amplification from top creators had stopped asking and started supplying.
The Creator Decision Filter
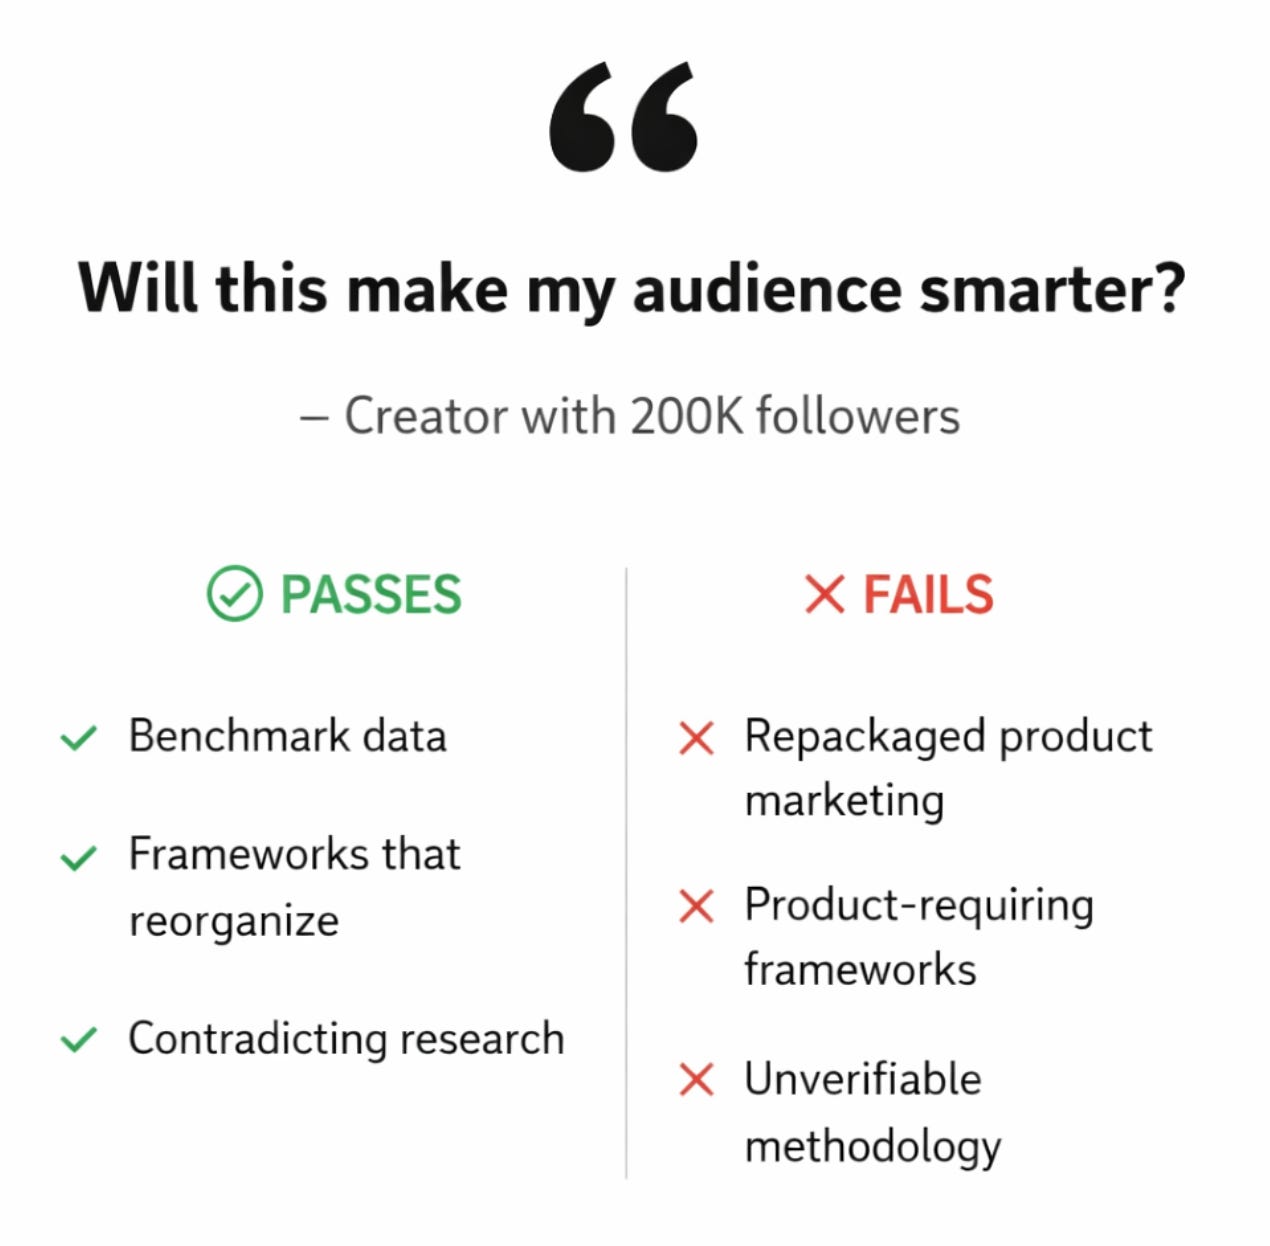
I asked a creator with 200K followers why she never shared vendor content.
Her answer:
“I ask one question… will this make my audience smarter? If it’s not, I will never share it.”
The filter is simple. Passing it is hard.
What passes:
Benchmark data answering questions their audience keeps asking
Frameworks that reorganize messy problems
Research that contradicts what everyone assumes is true
What fails:
“Research” that’s repackaged product marketing
Frameworks that suspiciously require your product
Data with no methodology anyone can verify
The distinction: insight assets vs marketing assets.
Marketing assets serve your goals. Insight assets serve creator audiences first—and your goals second, as a byproduct.
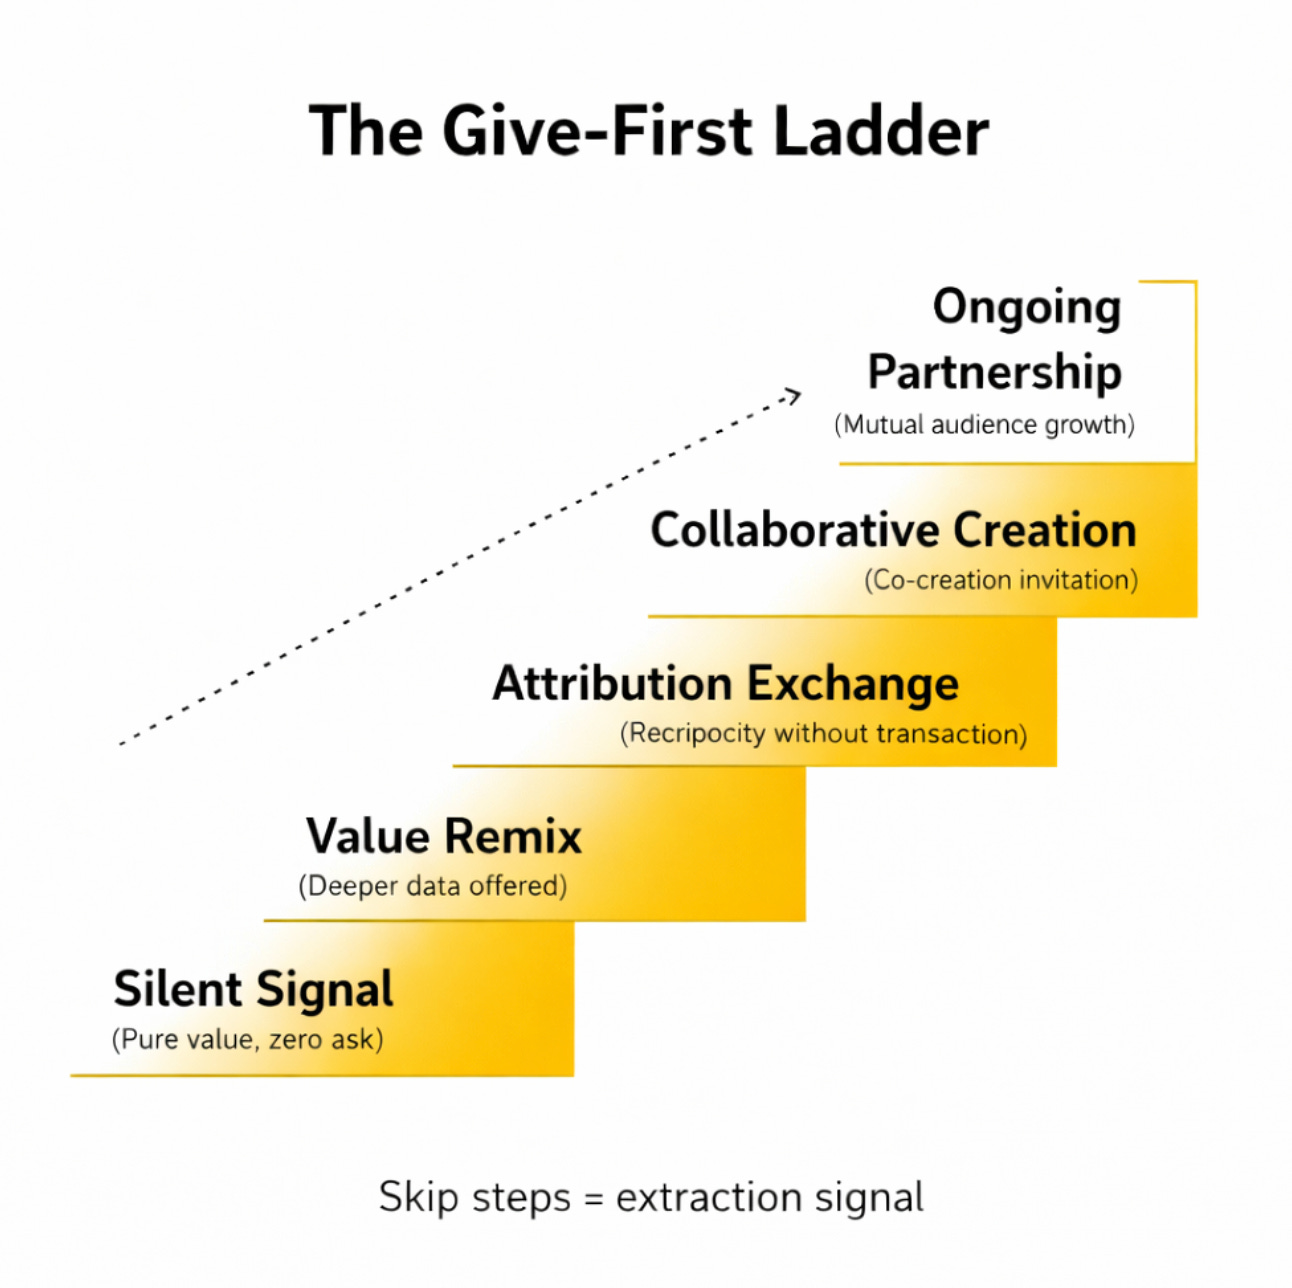
The Give-First Ladder
Progressive relationship building without extraction signals.
Step 1: Silent Signal
Share insight assets with zero ask.
No “let me know your thoughts.” No “would love to collaborate.” Pure value delivery.
Step 2: Value Remix
Creator engages with your content. Offer deeper data.
“Here’s the raw dataset if useful.” Still no ask.
Step 3: Attribution Exchange
Creator shares. Amplify their content. Reciprocity without transaction.
Step 4: Collaborative Creation
“We’re researching X. Your perspective would strengthen it.”
Co-creation, not sponsorship.
Step 5: Ongoing Partnership
Regular insight exchange. Mutual audience growth.
Each step requires the previous step. Skip steps → extraction signal.
The Ladder in Action
Here’s what this looked like for a startup I am building:
Week 1: Sent a “signal led prospecting” evolution framework and test metrics across accounts. No ask. Just: “Saw you writing about cold-calling. This might be useful.”
Week 3: Creator DM’d asking about methodology. Sent full dataset, framework, results plus analysis notes.
Week 5: Creator cited the data in their newsletter. 40K subscribers saw the original research.
Week 8: Creator reached out asking to co-author a deeper piece. Their audience became a pipeline.
Total cost: One analyst’s time for two weeks.
Total pitching: Zero.
The ladder only works if you never skip steps. The moment you ask before you’ve given repeatedly, you become noisy.
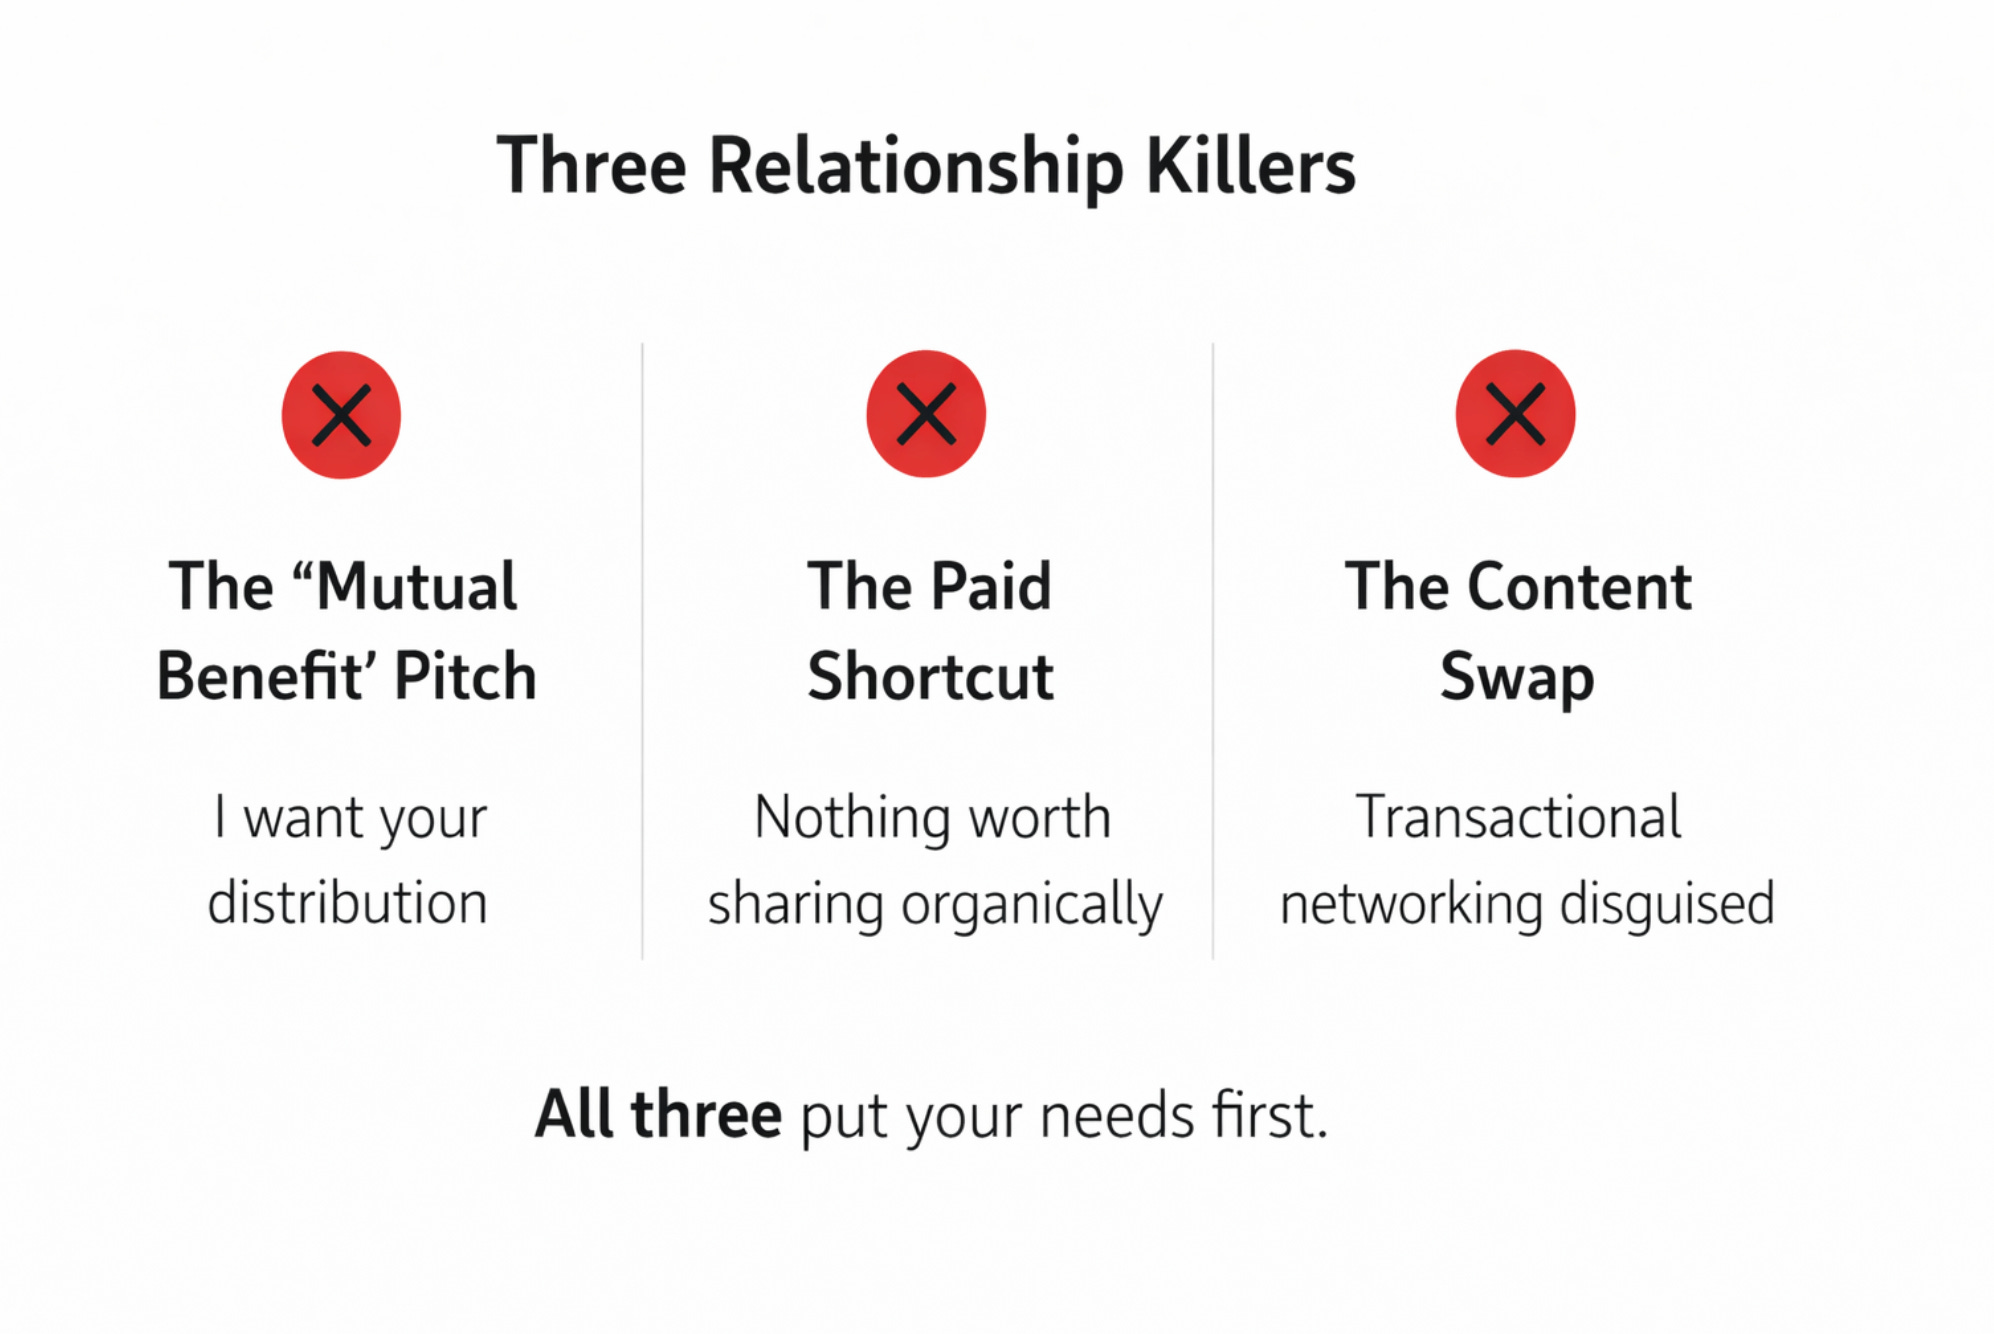
What Kills Creator Relationships (Common Mistakes)
I’ve watched companies sabotage creator relationships the same three ways:
1. The “Mutual Benefit” Pitch
“This would be great exposure for both our audiences!”
Translation: “I want your distribution.”
Creators see through this instantly. You’re not offering value—you’re asking for their audience.
2. The Paid Shortcut
Offering money before you’ve given anything for free signals desperation.
It says: “We have nothing worth sharing organically.”
The best creator relationships start with value, not transactions.
3. The Content Swap
“I’ll share yours if you share mine.”
This is transactional networking dressed as collaboration.
Creators with real audiences don’t need your shares. They need your insights.
The pattern: All three approaches put your needs first. They extract before depositing.
The give-first ladder inverts this. Every step deposits value before any withdrawal.
Which mistake have you caught yourself making? Comment below…
The Proof
Gong didn’t become the most-cited sales brand by pitching creators.
2018-2019: They published data nobody else had—insights from millions of analyzed sales calls.
One finding:
“Win rates are 10% higher when pricing is discussed on the first call.”
Counterintuitive. Backed by data no competitor could replicate. Impossible to ignore.
What happened next:
Sales creators started citing it. Chris Orlob’s posts featuring Gong data hit millions of views. Kyle Poyar referenced their benchmarks in pricing content. Sam McKenna built frameworks on their methodology.
Gong didn’t ask for any of this. They supplied the raw material creators needed.
The Flywheel
Quarterly benchmark releases → Creators cite data → Gong gets attribution → More people discover their research → Creators watch for next release
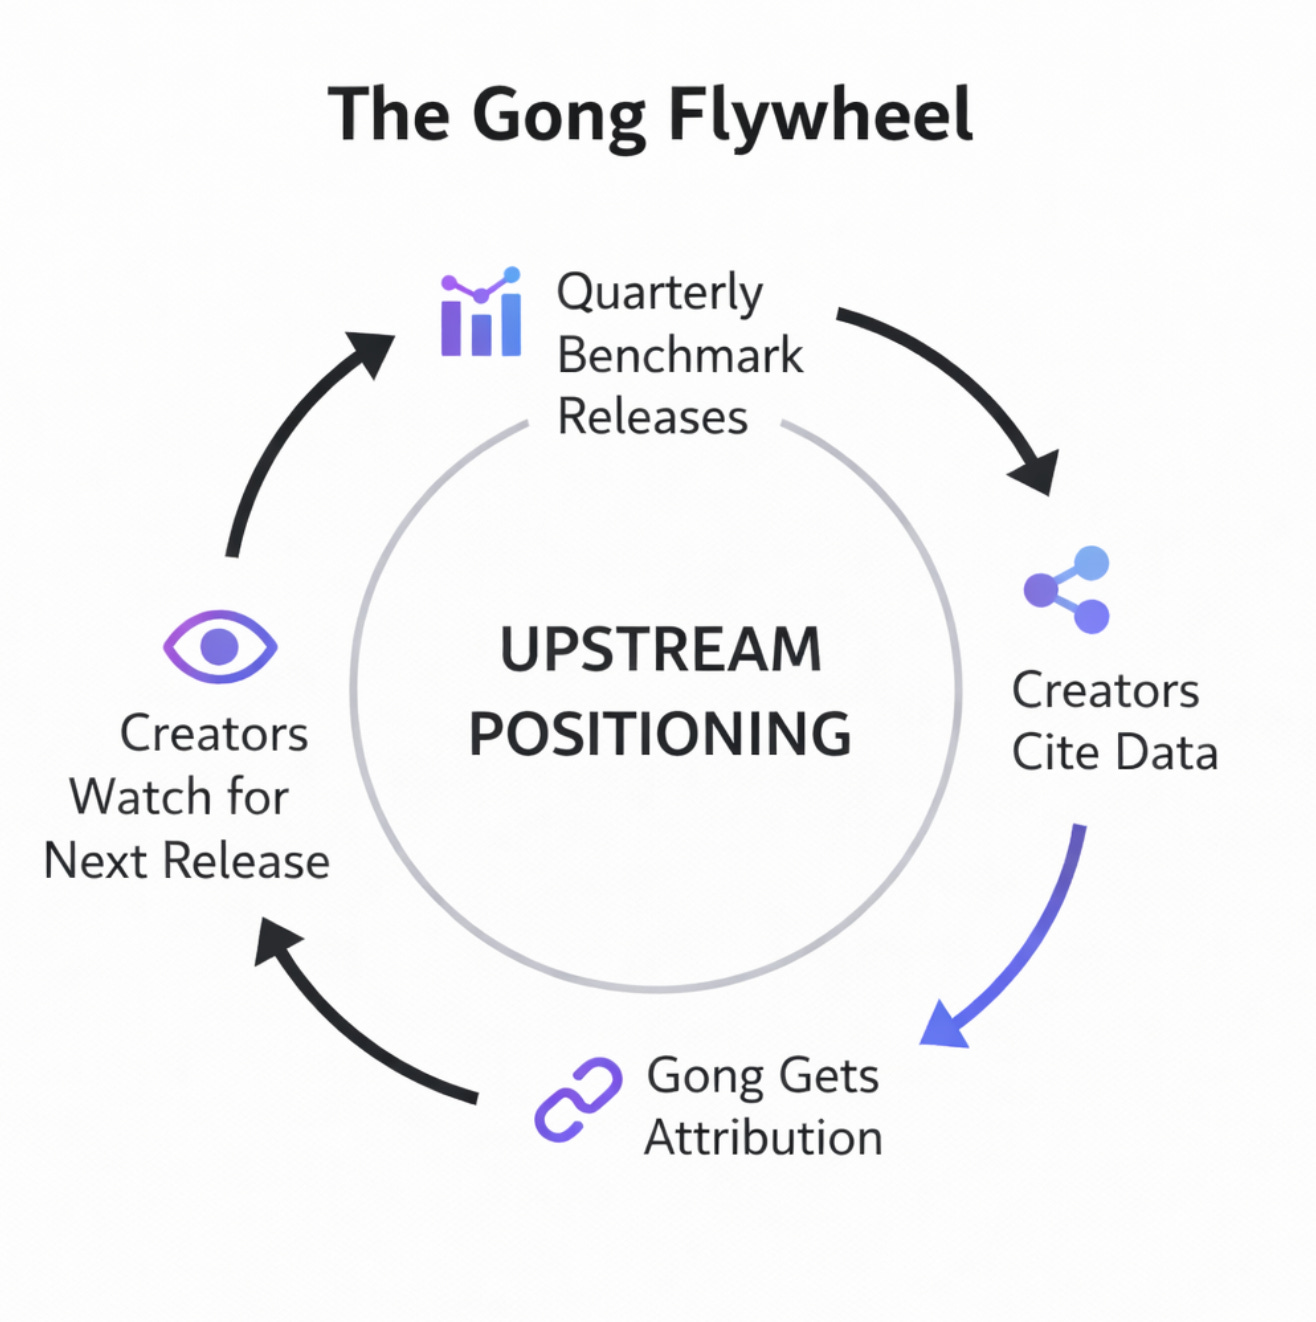
Result: Gong became upstream. Creators now check them proactively for new frameworks—no outreach required.
[Link to Gong Labs research: gong.io/resources/labs/]
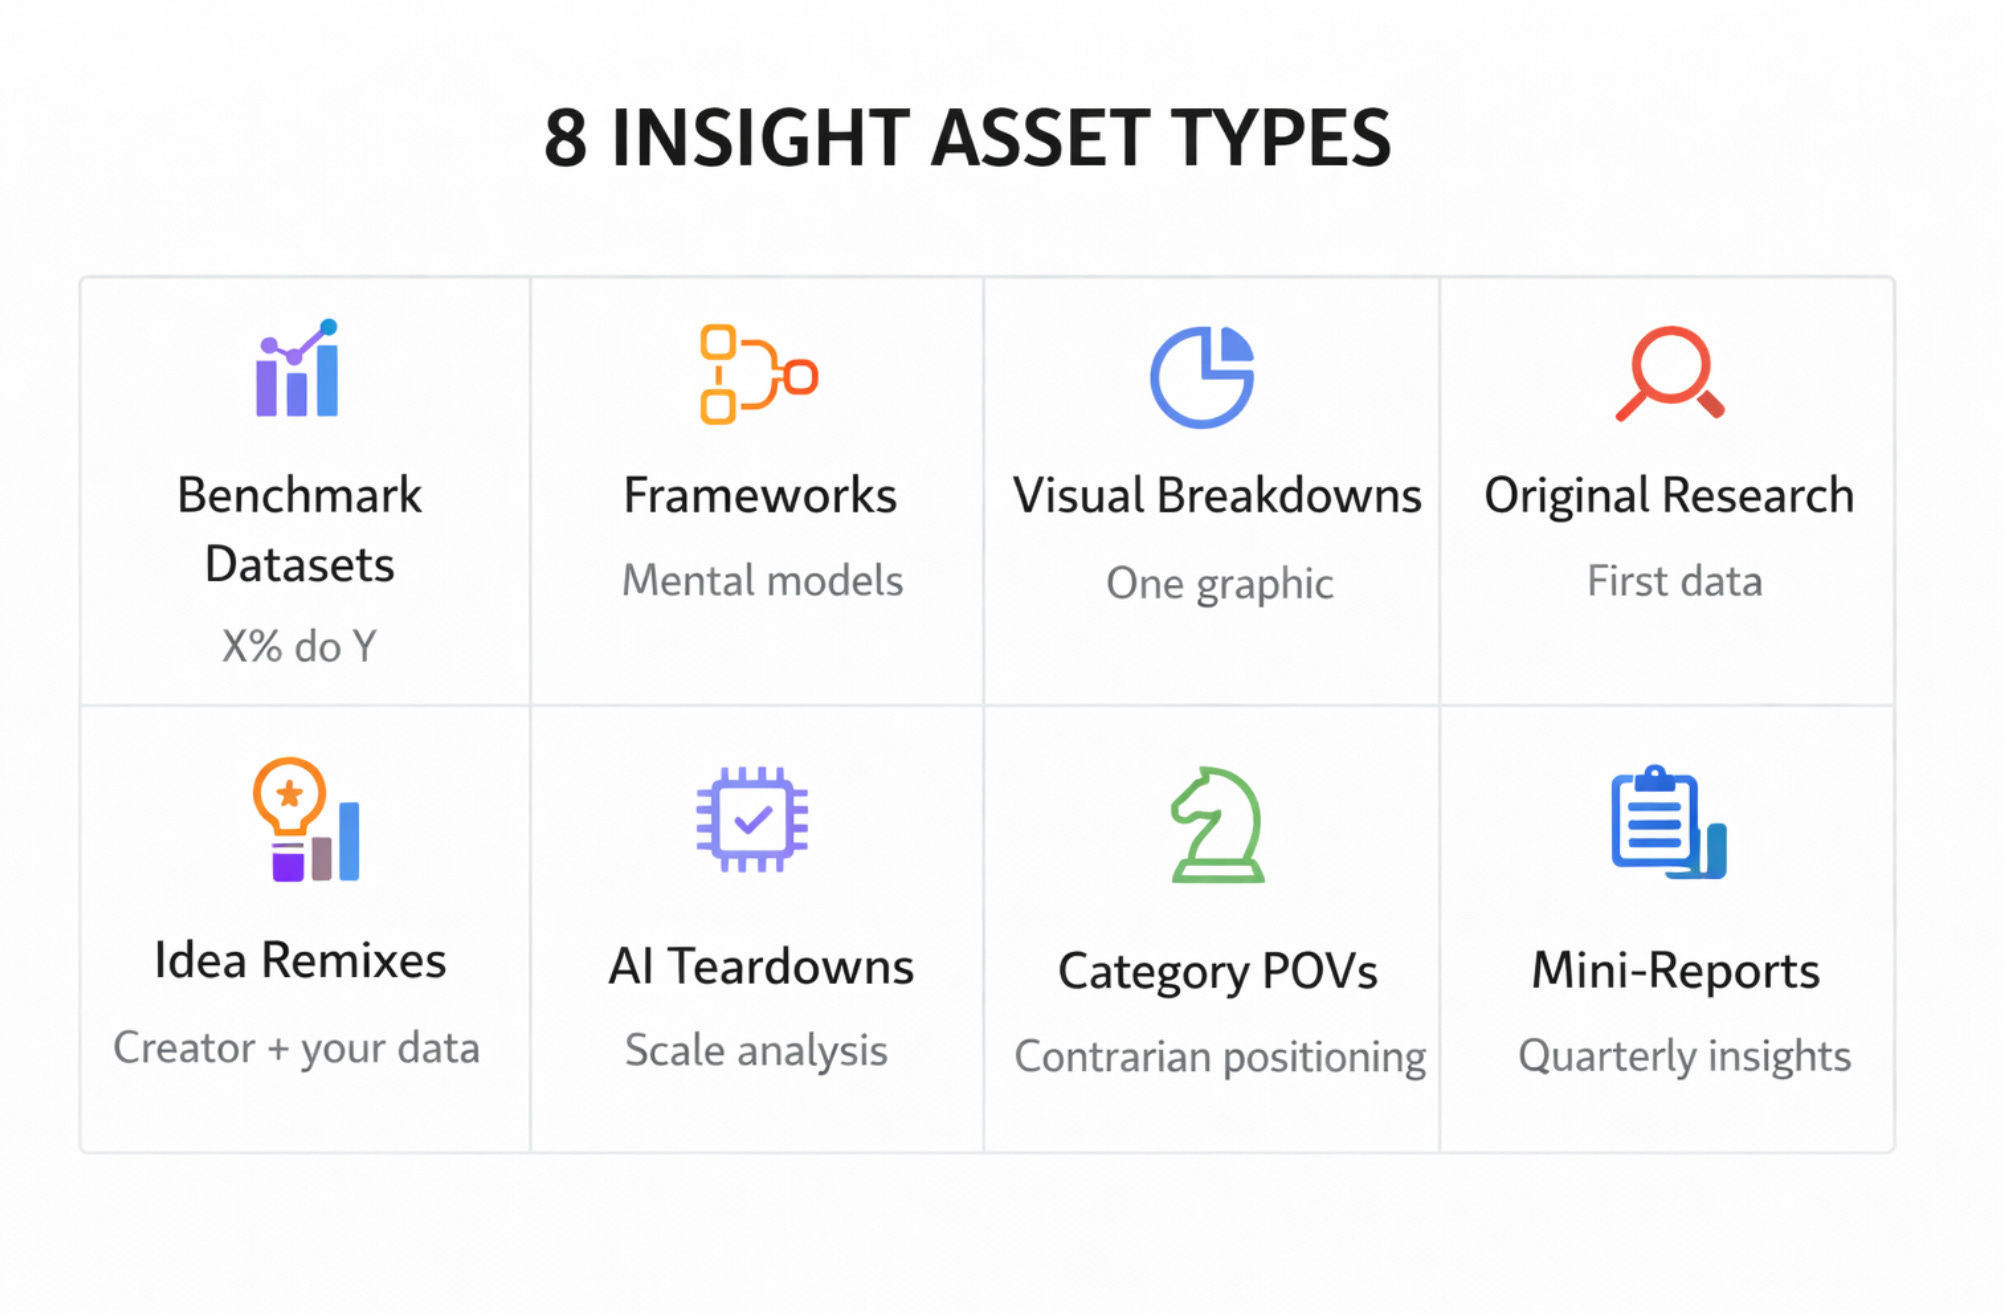
The 8 Insight Asset Types
What consistently earns creator shares:
1. Benchmark Datasets → “X% of companies do Y”
Example: OpenView’s annual SaaS benchmarks. Cited everywhere because nobody else compiles this.
2. Frameworks → Mental models that reorganize complexity
Example: Reforge’s “Loops vs Funnels” reframed how people think about growth.
3. Visual Breakdowns → Complex concepts compressed to one graphic
Example: Every Lenny Rachitsky essay has a diagram people screenshot and share.
4. Original Research → First comprehensive data on emerging topic
Example: Tomasz Tunguz was first to publish detailed data on AI startup metrics.
5. Idea Remixes → Taking a creator’s framework and adding your data
Example: “We applied [Creator]’s model to 500 companies. Here’s what we found.”
6. AI-Powered Teardowns → Systematic analysis at scale humans can’t do
Example: Analyzing 1,000 pricing pages, 500 onboarding flows, 200 sales decks.
7. Category POVs → Contrarian positioning on where an industry is heading
Example: “Why product-led growth is hitting a wall” with data to back it.
8. Proprietary Mini-Reports → Quarterly insights from your unique data
Example: Any company with user behavior data can publish “State of X” reports.
Pick one. Execute it brilliantly. Don’t try eight simultaneously.
The companies winning at this have one signature format:
Gong = benchmarks
Reforge = frameworks
First Round = interview-based research
What’s yours?
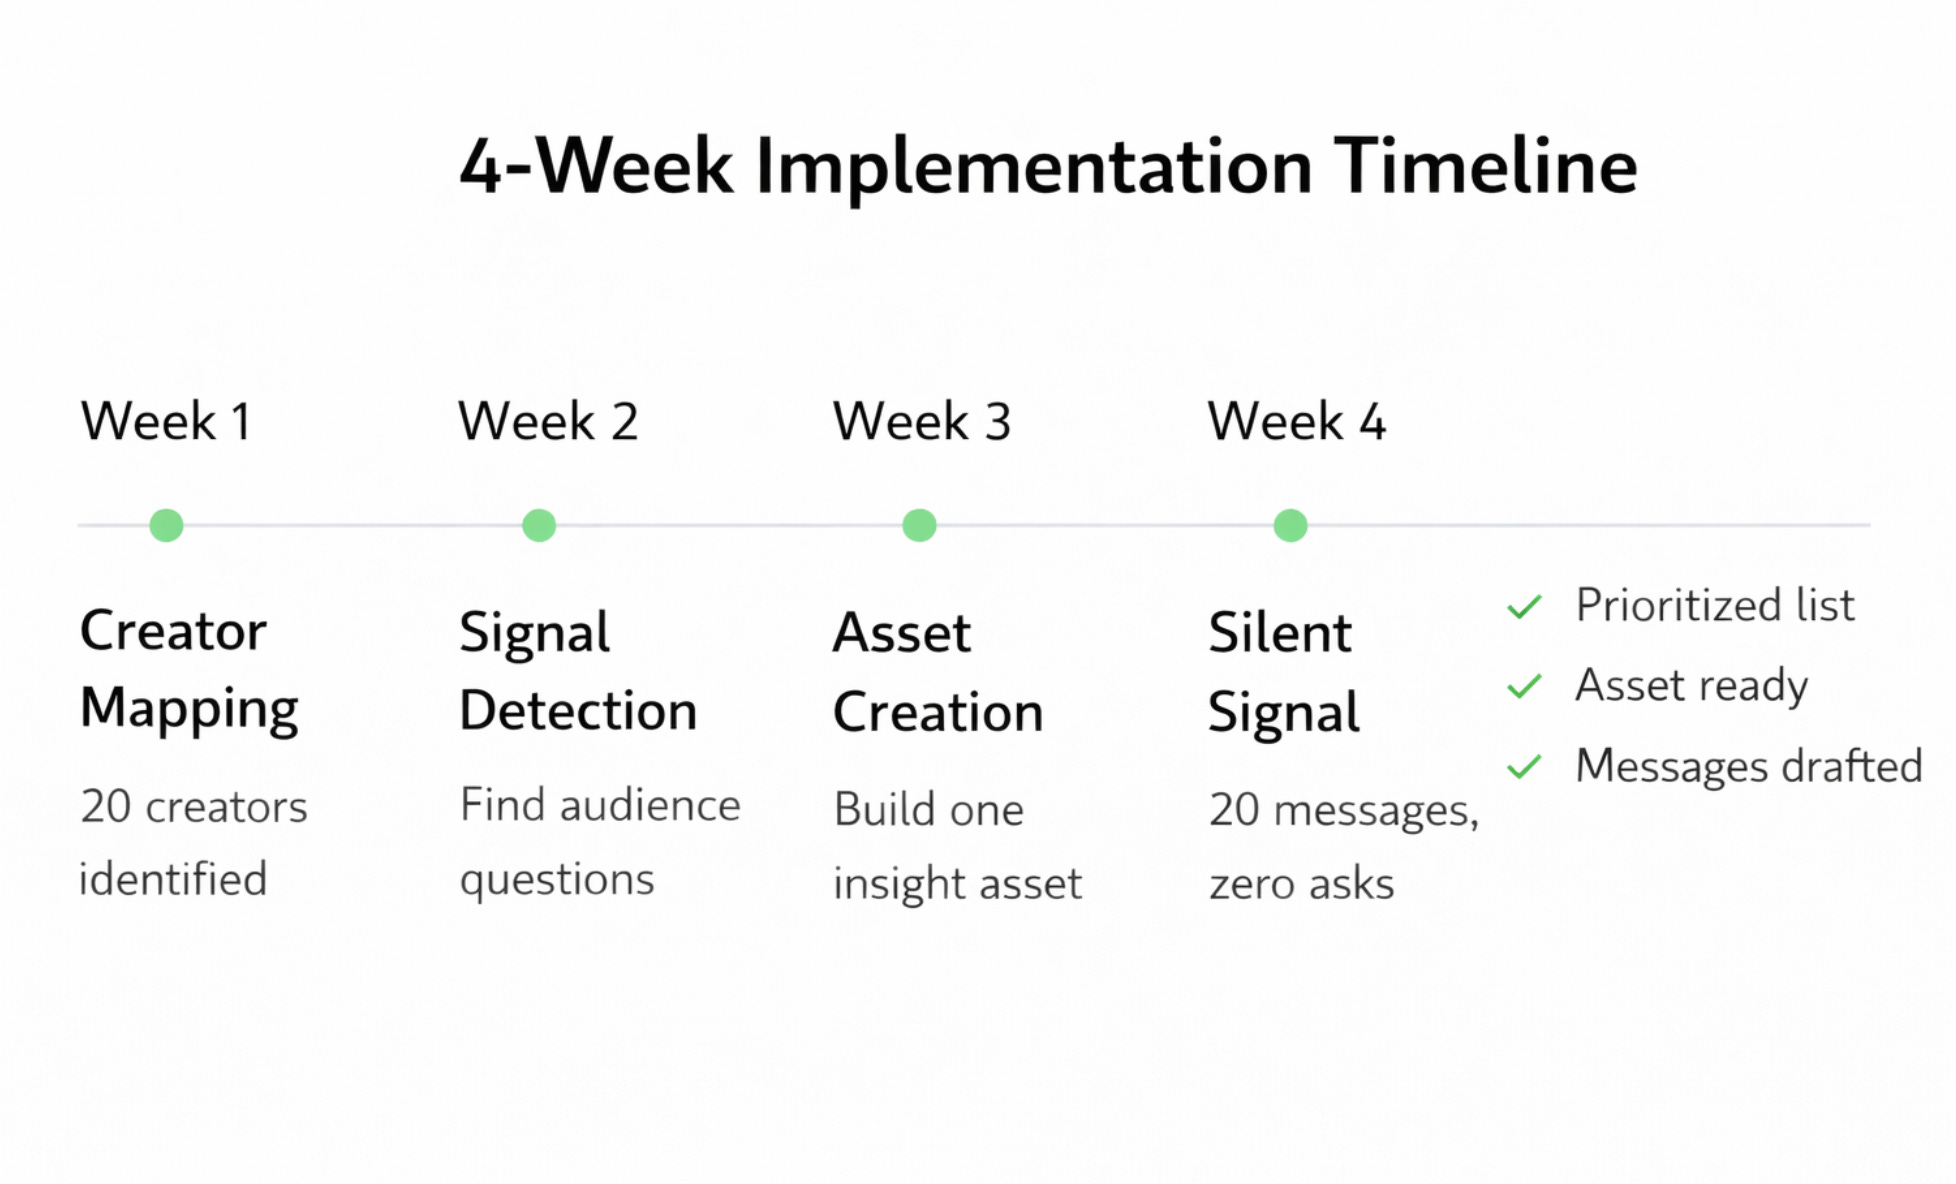
The Implementation
Week 1: Creator Mapping
Identify 20 creators in your space:
Tier-1 (100K+): 5 creators
Tier-2 (10K-100K): 10 creators
Tier-3 (1K-10K): 5 creators
Week 2: Signal Detection
Find one question their audiences repeatedly ask.
Check their content. Read comments. Identify the pain point.
Week 3: Asset Creation
Create one insight asset answering that question.
Use your data. Your frameworks. Your customer research.
Make it genuinely useful. Not promotional.
Week 4: Silent Signal
Share with zero ask.
“Thought this might help your audience. No action needed.”
Do this 20 times. 10% will engage. 5% will share.
That’s how upstream positioning starts.
The Outcomes
Here’s what I’ve seen from teams that execute this consistently (not cherry-picked wins but realistic ranges):
Pipeline from creator channels: 20-50 qualified leads/month for companies in the $5-30M ARR range. Smaller companies see lower volume but higher conversion.
CAC impact: 30-50% lower than paid acquisition but this varies wildly by category. The real win is that these leads already trust you.
Sales cycle: Noticeably shorter when the buyer saw a creator mention first. Hard to quantify precisely, but sales teams report “they come in warmer.”
What This Won’t Do:
Work in month one. Timeline to flywheel activation: 6-9 months minimum.
Replace all other channels. This is a compounding investment, not a silver bullet.
Succeed without genuine insight production. If you’re repackaging marketing as research, creators will know.
The companies that abandon this at month 3 never see the returns.
The ones that persist for 12+ months build moats competitors can’t copy.
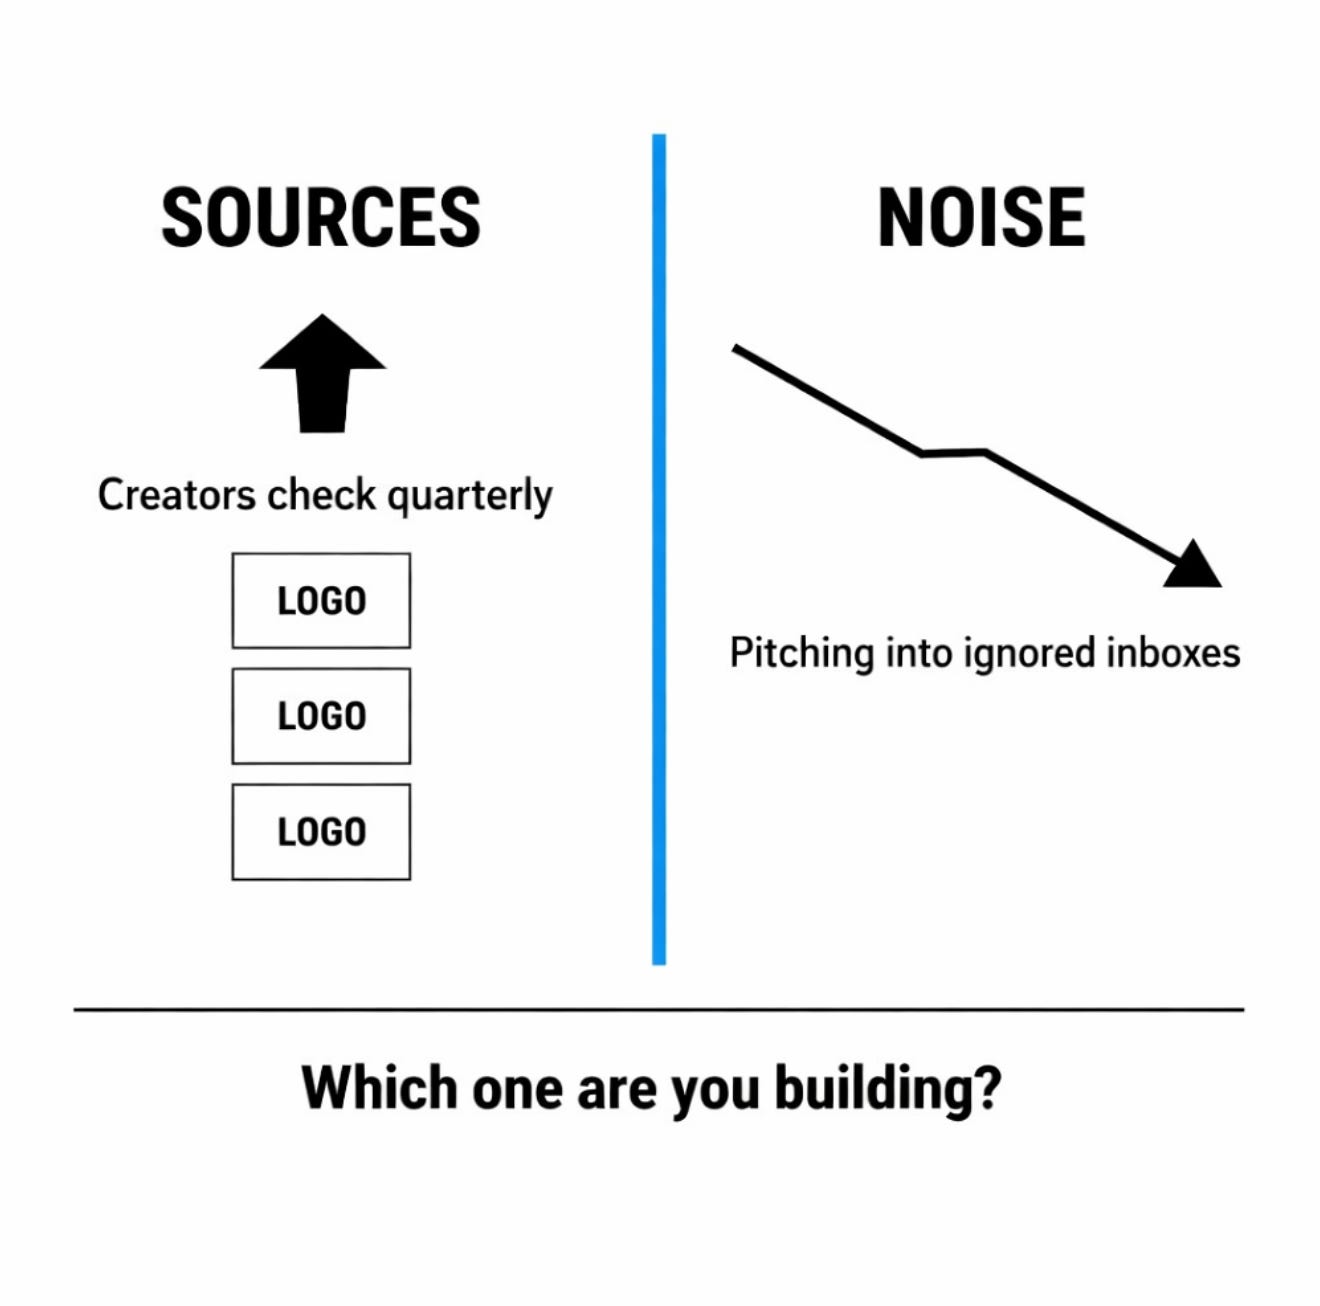
The Choice
There are two types of B2B companies now:
Sources — The ones creators check quarterly for new data. They never pitch. They supply.
Noise — Everyone else pitching collaborations into inboxes creators stopped reading years ago.
Gong became a source. So did Reforge. So did First Round.
The playbook isn’t secret. It’s just that most companies won’t do the work of producing genuine insight.
The question isn’t whether this works.
It’s whether you’ll invest 6-9 months in building something that compounds—or keep pitching into the void.
OPERATOR’S TOOLKIT
Production-Ready Prompts for Every Stage
Save this section. These prompts eliminate 80% of creation friction.
QUICK REFERENCE: WHICH PROMPT DO I NEED?
RESEARCH PHASE
Prompt #1: Creator Mapper → Use when you need to identify which creators to target
Prompt #2: Pain Point Detector → Use when you need to find what their audience wants
CREATE PHASE
Prompt #3: Benchmark Generator → Use when you’re building a data-driven asset
Prompt #4: Framework Builder → Use when you’re creating a mental model
Prompt #5: Visual Creator → Use when you need a shareable graphic
DISTRIBUTE PHASE
Prompt #6: Silent Signal → Use when you’re doing first outreach (no ask)
Prompt #7: Follow-up Sequence → Use when a creator engaged and you need next steps
OPTIMIZE PHASE
Prompt #8: Response Analyzer → Use when you want to see what’s working
Prompt #9: Content Multiplier → Use when you have one asset and need 10 formats
Prompt #10: Flywheel Tracker → Use when you want to measure momentum
Starting from zero? Run #1, #3, and #6 this week. That’s your foundation.
STAGE 1: CREATOR RESEARCH
Prompt 1: Creator Ecosystem Mapper
You are a B2B creator ecosystem analyst.
TASK: Map the creator landscape for [YOUR INDUSTRY/DOMAIN].
INPUTS:
- Industry: [e.g., B2B SaaS GTM, Revenue Operations, Product Marketing]
- Geography: [e.g., North America, Global]
- Audience size range: [e.g., 10K-500K followers]

OUTPUTS:
Create a table with these columns:
1. Creator Name
2. Platform (LinkedIn/Twitter/Newsletter)
3. Follower Count (approximate tier)
4. Content Themes (3-5 core topics)
5. Audience Type (e.g., “VP Sales at $10M-$100M SaaS”)
6. Engagement Pattern (high/medium/low + avg comments per post)
7. Share Behavior (what types of content they amplify)
8. Collaboration Openness (open/selective/closed based on observable patterns)

PRIORITIZATION:
Rank by “Insight Asset Receptivity Score”:
- High: Regularly shares frameworks, data, research from others
- Medium: Occasionally shares third-party insights
- Low: Primarily original content only

DELIVERABLE:
20 creators minimum, sorted by receptivity score.
Include links to 2-3 representative posts showing their share behavior.

FORMAT: Markdown table, copy-paste ready to spreadsheet.
Prompt 2: Audience Pain Point Detector
You are a content pattern analyst specializing in identifying unmet information needs.

TASK: Analyze [CREATOR NAME]’s content to identify the questions their audience repeatedly asks but aren’t fully answered.

INPUTS:
- Creator: [Name + platform]
- Content sample: [Paste 10-15 recent posts with top comments]
- Time period: [e.g., Last 3 months]

ANALYSIS FRAMEWORK:
1. Explicit Questions: Direct questions in comments
2. Implicit Pain Points: Frustrations expressed without direct questions
3. Topic Clusters: Recurring themes across multiple posts
4. Information Gaps: Topics referenced but not fully explained
5. Debate Points: Areas where audience disagrees or seeks clarity

OUTPUTS:
For each identified pain point, provide:
- Pain Point Statement: [One sentence]
- Evidence: [2-3 comment examples or post snippets]
- Frequency: [High/Medium/Low based on recurrence]
- Asset Opportunity: [What type of insight asset would address this]
- Competitive Landscape: [Has anyone else addressed this comprehensively?]

PRIORITIZATION MATRIX:
Rank by:
- Frequency (how often it appears)
- Intensity (how much frustration/interest)
- Gap (how underserved the answer is)

DELIVERABLE: Top 5 pain points ranked by opportunity score.

FORMAT: Table with columns: Pain Point | Evidence | Frequency | Asset Type | Priority
STAGE 2: INSIGHT ASSET CREATION
Prompt 3: Benchmark Dataset Generator
You are a research analyst creating proprietary benchmark datasets from internal company data.

TASK: Transform [YOUR INTERNAL DATA] into a shareable benchmark insight that serves creator audiences.

INPUTS:
- Data source: [e.g., “We’ve analyzed 500 sales calls”, “We track 200 SaaS pricing pages”]
- Domain: [e.g., Sales qualification, Pricing strategies, Product adoption]
- Audience: [Who will find this useful?]

FRAMEWORK: The Reality vs Fantasy Structure

Identify 5-7 conventional wisdom beliefs, then present contradicting data.

OUTPUT FORMAT:
**Title**: “We analyzed [X] and found [surprising pattern]”
**Hook**: [One surprising finding that contradicts conventional wisdom]

**Benchmark Insights** (5-7 items):
For each insight:
1. Conventional Wisdom: [What most people believe]
2. Actual Data: [What your data shows]
3. Percentage/Metric: [Quantified finding]
4. Implication: [What this means for the audience]

**Methodology Note**: [Brief explanation of data source and collection method for credibility]

**Shareable Assets**:
- 1-sentence summary for social
- 3-5 key stats formatted for graphics
- One-page PDF summary

QUALITY CRITERIA:
□ Each insight challenges existing belief
□ Metrics are specific (not “most” or “many”)
□ Data source is credible and stated
□ Insights are immediately actionable
□ No promotional content embedded

DELIVERABLE: Complete benchmark report ready for creator sharing.
Prompt 4: Framework Architect
You are a strategic framework designer creating mental models that reorganize complexity.

TASK: Create a framework that helps [TARGET AUDIENCE] think differently about [PROBLEM/TOPIC].

INPUTS:
- Problem: [What challenge does audience face?]
- Current thinking: [How do people typically approach this?]
- Your insight: [What do you know that they don’t?]
- Audience: [Who will use this?]

FRAMEWORK DESIGN PRINCIPLES:
1. Simplification: Reduce complexity to 3-5 core components
2. Memorability: Use clear naming conventions
3. Actionability: Each component implies specific actions
4. Novelty: Reorganizes thinking, not just relabels existing concepts

OUTPUT STRUCTURE:
**Framework Name**: [Descriptive + Memorable]
Example: “The Give-First Ladder” not “Creator Relationship Model”

**One-Line Description**: [What it helps you do]

**Visual Representation**: [Describe how this would be visualized]

- Linear? (A → B → C)
- Matrix? (2x2 grid)
- Pyramid? (hierarchy)
- Cycle? (circular flow)

**Components**: [3-5 parts]

For each component:
- Name: [Clear label]
- Definition: [One sentence]
- When to use: [Context]
- Common mistake: [What not to do]

**Application Example**: [One detailed scenario showing framework in action]

**Comparison**: [How is this different from existing approaches?]

VALIDATION CHECKLIST:
□ Can be explained in 60 seconds
□ Immediately applicable
□ Changes how audience thinks about the problem
□ Memorable naming
□ Visual representation is clear
□ No jargon without definition

DELIVERABLE: Complete framework document + visual description.
Prompt 5: Visual Breakdown Creator
You are a visual concept designer translating complex ideas into shareable graphics.

TASK: Transform [COMPLEX CONCEPT] into a visual breakdown optimized for creator sharing.

INPUTS:
- Concept: [What are you explaining?]
- Audience: [Who needs to understand this?]
- Current confusion: [What do people get wrong?]
- Platform: [LinkedIn/Twitter/Newsletter]

VISUAL FRAMEWORKS TO CHOOSE FROM:
1. Process Flow: Step-by-step progression
2. Comparison Matrix: A vs B across dimensions
3. Hierarchy Pyramid: Layers of importance/priority
4. Timeline/Phases: Evolution over time
5. System Diagram: Interconnected components
6. Before/After: State transformation
7. Decision Tree: Choice pathways

OUTPUT SPECIFICATION:
**Graphic Type**: [Choose from above]
**Layout Description**:
- Dimensions: [e.g., 1200x1200 for LinkedIn, 1600x900 for presentation]
- Sections: [How is space divided?]
- Flow direction: [Top to bottom? Left to right?]

**Content Elements**:
For each section of the visual:
- Text: [Exact wording, max 7 words per element]
- Visual metaphor: [Icons, arrows, shapes to use]
- Color coding: [If using colors to convey meaning]
- Hierarchy: [What should stand out most?]

**Annotations**: [2-4 callout points highlighting key insights]
**Caption for Social**:
- Hook line: [First sentence, <140 characters]
- Context: [2-3 sentences explaining the visual]
- Takeaway: [One action audience should take]

**Tool Instructions**: [Step-by-step Canva/Figma instructions for creation]

DESIGN PRINCIPLES:
□ 7 words or less per text block
□ Clear visual hierarchy
□ One main point per graphic
□ Scannable in 5 seconds
□ Works without caption (but caption strengthens it)
□ Brand-neutral (no logos, promotional elements)

DELIVERABLE: Complete design brief ready for graphic designer or AI tool.
STAGE 3: STRATEGIC OUTREACH
Prompt 6: Silent Signal Message Generator
You are a relationship-first outreach specialist writing zero-extraction creator messages.

TASK: Write a Silent Signal message to [CREATOR NAME] sharing [INSIGHT ASSET] with no asks.

INPUTS:
- Creator: [Name + why you’re reaching out to them specifically]
- Asset: [What you’re sharing]
- Relevance: [Why this serves their audience]
- Relationship status: [First contact / Previous interaction]

FRAMEWORK: The FYI Model
- Context: Why this might be relevant (1 sentence)
- Value: What the asset contains (2 sentences)
- No-Ask Close: Explicit statement of no expectations

OUTPUT TEMPLATE:
**Subject Line**: [Relevant, non-promotional, specific]

Examples:
- “Data on [topic they cover]”
- “[Insight] from analyzing [X]”
- “Research that might interest your audience”

**Message** (150 words maximum):
[Personalization: Reference their recent content or known interest - 1 sentence]
[Context: What you created and why - 1 sentence]
[Value Delivery: What’s in the asset - 2-3 sentences]
[No-Ask Close: Explicit no-expectations statement]

---

ANTI-PATTERNS TO AVOID:
❌ “Would love your thoughts”
❌ “Let me know if you’d like to collaborate”
❌ “Can I send you more information?”
❌ “Would you be open to sharing this?”
❌ Any question mark except in genuine question
❌ “Just wanted to reach out”
❌ “Hope this finds you well”

QUALITY CHECKLIST:
□ Personalization is specific (not generic “I love your content”)
□ Value is clear in 10 seconds
□ Zero extraction signals
□ No embedded asks
□ Tone is peer-to-peer, not vendor-to-influencer
□ Asset link is direct (no landing pages, no forms)
□ Subject line passes “would I open this?” test

DELIVERABLE: 3 variations of the message for A/B testing.
Prompt 7: Value Remix Offering
You are a strategic relationship builder crafting Step 2 messages after creator engagement.

CONTEXT: Creator responded positively to your Silent Signal. Now deepen value without extraction.

TASK: Write a Value Remix message offering deeper assets/data to support their content creation.

INPUTS:
- Creator: [Name]
- Their response: [What they said]
- Deeper asset available: [What additional value you can provide]
- How it helps them: [Specific benefit to their content/audience]

FRAMEWORK: The “If Useful” Model
- Acknowledge their response
- Offer deeper asset
- Frame as optional tool for them
- No expectations

OUTPUT TEMPLATE:
**Subject**: Re: [previous subject]
[Acknowledge their response - 1 sentence]
[Offer deeper asset - “If useful, I have [X] that might help with [specific creator need]” - 2 sentences]
[What’s in it: Specific utility - 1-2 sentences]
[No-pressure close: “No action needed. Just wanted to share in case helpful.”]

---

EXAMPLES OF DEEPER ASSETS:
- Raw dataset behind the benchmark
- Expanded framework with implementation templates
- Additional case studies not in public version
- Early access to upcoming research
- Custom analysis for their specific audience

RELATIONSHIP SIGNALS TO INCLUDE:
✓ Reference specific point from their response
✓ Connect to their known content themes
✓ Acknowledge their audience’s specific needs
✓ Maintain peer dynamic (not vendor-influencer)

ANTI-PATTERNS:
❌ “In exchange for...”
❌ “If you share this...”
❌ “We’d love to partner...”
❌ Moving too fast to collaboration ask

DELIVERABLE: Single polished message ready to send.
STAGE 4: OPTIMIZATION & SCALING
Prompt 8: Creator Response Analyzer
You are a pattern recognition analyst identifying what drives creator engagement and sharing.

TASK: Analyze responses from creator outreach to identify success patterns and optimize approach.

INPUTS:
- Outreach batch: [Number of creators contacted]
- Response data: [Who responded, who shared, who ignored]
- Asset types: [What you sent to each]
- Creator tiers: [Distribution across tier-1, tier-2, tier-3]

ANALYSIS FRAMEWORK:
**1. Response Rate Analysis**
- Overall response rate: [X/Y contacted]
- By creator tier: [Tier-1: X%, Tier-2: Y%, Tier-3: Z%]
- By asset type: [Benchmark: X%, Framework: Y%, etc.]
- By message approach: [Pattern differences in responses]

**2. Share Rate Analysis**
- Creators who shared: [List]
- Time to share: [How long between outreach and share]
- Share format: [Direct link, screenshot, remix into own content]
- Attribution quality: [Did they credit you properly?]

**3. Pattern Identification**
What do high-response creators have in common?
- Content themes
- Audience characteristics
- Engagement patterns
- Prior sharing behavior

**4. Asset Performance**
Rank asset types by:
- Response rate
- Share rate
- Engagement on shared content
- Lead generation (if trackable)

**5. Message Optimization**
Compare variations:
- Subject lines that worked vs didn’t
- Personalization approaches that resonated
- Timing of outreach (day/time)
- Follow-up effectiveness

OPTIMIZATION RECOMMENDATIONS:
**What to do more of**:
1. [Specific action based on success pattern]
2. [Specific action based on success pattern]
3. [Specific action based on success pattern]

**What to stop doing**:
1. [Specific action based on failure pattern]
2. [Specific action based on failure pattern]

**What to test next**:
1. [Hypothesis for improvement]
2. [Hypothesis for improvement]

DELIVERABLE: Optimization report with specific next actions.
Prompt 9: AI-Powered Content Multiplier
You are a content multiplication specialist creating derivative assets from one core insight.

TASK: Transform [CORE INSIGHT ASSET] into 10 different formats for maximum distribution and creator appeal.

INPUT:
- Core asset: [Description of main framework/data/research]
- Original format: [Blog post / Report / Framework document]
- Target creators: [Who should this reach?]

MULTIPLICATION FRAMEWORK:
**Asset 1: LinkedIn Carousel** (10 slides)
- Slide 1: Hook + Problem
- Slides 2-8: Core insights (one per slide)
- Slide 9: Synthesis
- Slide 10: Attribution + CTA

**Asset 2: Twitter Thread** (10-12 tweets)
- Tweet 1: Hook
- Tweets 2-10: Insights (one per tweet)
- Final tweet: Synthesis + link

**Asset 3: One-Page PDF Summary**
- Header: Main finding
- 4 quadrants: Key insights
- Footer: Methodology + link

**Asset 4: Data Visualization**
- Single compelling chart/graph
- Shows most surprising finding
- Annotated for clarity

**Asset 5: Quote Graphics** (5 variations)
- Pull most shareable statements
- Design as text-on-color graphics
- Size for each platform

**Asset 6: Mini Case Study** (500 words)
- Focus on one application of framework
- Detailed example
- Actionable takeaways

**Asset 7: Video Script** (90 seconds)
- Hook: 10 seconds
- Insight: 60 seconds
- Action: 20 seconds

**Asset 8: Newsletter Section**
- Intro: Why this matters now
- Core insight: 200 words
- Takeaway: What to do with this

**Asset 9: Comparison Chart**
- Old way vs New way
- Before vs After
- Myth vs Reality

**Asset 10: FAQ Sheet**
- 5-7 common questions about the insight
- Clear, concise answers
- Anticipate objections

FOR EACH ASSET:
- Exact content/copy
- Design specifications
- Platform optimization notes
- Creator sharing prompt (how to position when sending)

DELIVERABLE: 10 ready-to-produce assets from one core insight.
Prompt 10: Flywheel Momentum Tracker
You are a GTM analyst measuring creator-led distribution flywheel performance.

TASK: Analyze creator amplification data to identify flywheel activation and acceleration patterns.

INPUTS:
- Time period: [e.g., Last 6 months]
- Creator shares: [List of when/who shared]
- Traffic data: [Visits from creator channels]
- Lead data: [Leads attributed to creator mentions]
- Relationship data: [Creator engagement over time]

FLYWHEEL METRICS:
**Input Metrics** (What you’re putting in)
- Insight assets published: [Number per month]
- Creator outreach volume: [Contacts per month]
- Time invested: [Hours per month]

**Throughput Metrics** (What’s happening)
- Creator response rate: [% responding]
- Creator share rate: [% sharing]
- Share frequency: [Shares per creator per quarter]
- Engagement on shared content: [Avg comments/likes]

**Output Metrics** (What you’re getting out)
- Traffic from creator channels: [Monthly visitors]
- Leads from creator attribution: [Monthly leads]
- SQLs from creator pipeline: [Monthly SQLs]
- Creator-influenced closed deals: [Monthly]

**Acceleration Indicators** (Is flywheel spinning faster?)
Calculate month-over-month changes:
- Share rate trend: [Increasing/Flat/Decreasing]
- Response speed: [Time from publish to share]
- Organic discovery: [Creators finding you without outreach]
- Repeat sharers: [% of creators sharing 2+ times]

FLYWHEEL STATUS ASSESSMENT:
**Phase 1: Push Required** (Months 1-3)
- High effort, low output
- Manual outreach dominant
- Few repeat interactions
- Status: [Are you here?]

**Phase 2: Early Traction** (Months 4-6)
- Some creators engaging repeatedly
- Occasional organic shares
- Creator-to-creator referrals starting
- Status: [Are you here?]

**Phase 3: Flywheel Activation** (Months 7-9)
- Creators proactively monitoring you
- Regular repeat sharers (3+)
- Creator referrals to other creators
- Reduced outreach effort needed
- Status: [Are you here?]

**Phase 4: Self-Sustaining** (Months 10+)
- Creators checking your content regularly
- Organic discovery exceeds outreach
- Tier-1 creators engaging
- Flywheel requires maintenance, not push
- Status: [Are you here?]

OPTIMIZATION RECOMMENDATIONS:
Based on current phase:
1. [Specific action to accelerate flywheel]
2. [Specific action to accelerate flywheel]
3. [Specific action to accelerate flywheel]

DELIVERABLE: Flywheel status report with phase assessment and acceleration plan.
Start This Week
Don’t save this for “later.” Later means never.
Day 1: Run Prompt #1. Map 20 creators.
Day 2-3: Run Prompt #2 on your top 5. Find their audience’s unanswered questions.
Day 4-5: Run Prompt #3. Create one benchmark from your data.
Day 6-7: Run Prompt #6. Draft 20 silent signal messages.
By next Monday, you’ll have:
A prioritized creator list
One insight asset ready to share
20 messages drafted with zero ask
That’s the foundation. Everything else builds from there.
Hit reply and tell me which insight asset type you’re building first. I read every response.
Loved this post?
And subscribe to “Prompts Daily Newsletter” as well…
If you’re not a subscriber, here’s what you missed earlier:
How You Should Actually Plan 2026: [Implementation Guide with Prompts]
Find trends before others: Frameworks, Techniques, Sources and Prompts
The Market Entry Timing Equation: When Being Early Wins and When It Kills You
The Viral LinkedIn GTM Playbook: Frameworks That Drove Engagement and Leads
The Offer Testing Matrix: 6 B2B Hooks That Convert Cold Prospects into Pipeline
Subscribe to get access to the latest marketing, strategy and go-to-market techniques . Follow me on Linkedin and Twitter.